Labs/Memory Profiler
< Labs(Redirected from Labs/Jetpack/Binary Components)
Jump to navigation
Jump to search
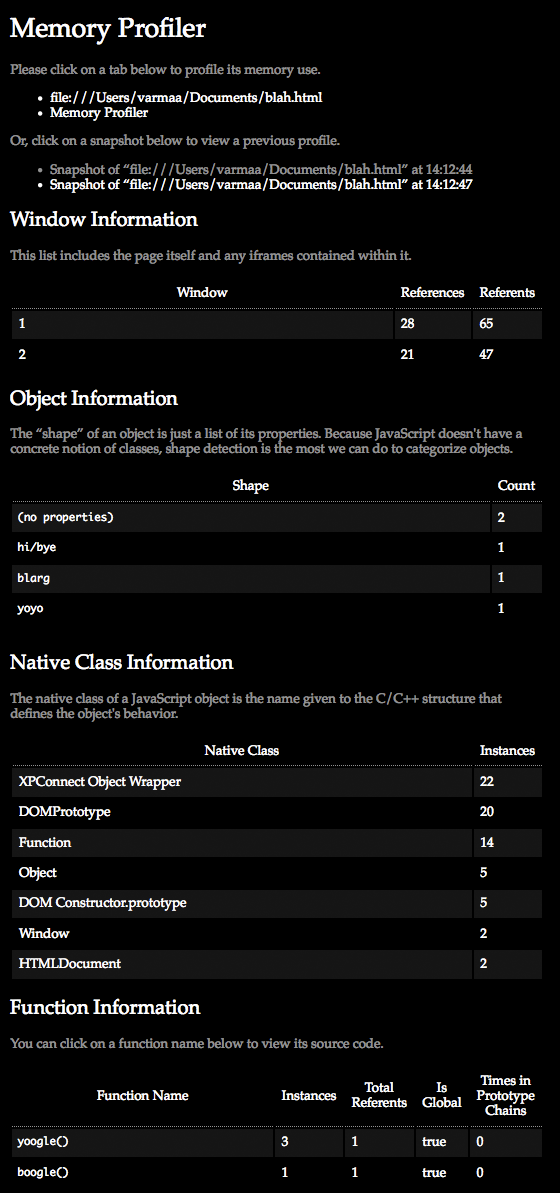
Memory Profiler is an experimental Labs project that attempts to make debugging memory use in web pages easier.
For more information about the tool's design and rationale, see Atul's blog post entitled Web Application Memory Profiling, Take Two.
Installation and Use
The Firefox extension is available here:
https://addons.mozilla.org/en-US/firefox/addon/14666/
You can access the tool by going to the "Tools" menu and selecting "Memory Profiler".
Development
The binary component for the memory profiler has been moved to the Jetpack SDK; Markdown documentation for it can be found here:
http://hg.mozilla.org/labs/jetpack-sdk/file/tip/packages/nsjetpack/docs/nsjetpack.md
See Atul's blog post entitled Fun with SpiderMonkey for information on how the memory profiler works.