TestEngineering/Performance/Sheriffing/Workflow: Difference between revisions
Alexandrui (talk | contribs) No edit summary |
Alexandrui (talk | contribs) |
||
| Line 62: | Line 62: | ||
= How to read the graph = | = How to read the graph = | ||
Before doing any investigation, you '''should assign''' the alert to yourself by clicking on [[File:Take button.png|Take button]] as described in [https://docs.google.com/document/d/1P7s4Co1jjY6KtXRHP3NEvN3rLFJ0RToc_pH9qfblE9E/edit#heading=h.q3d2le5h88n4 Updating alerts’ status] section. | |||
<br /> | |||
To read the graph of a certain alert, you just need to put the mouse over it and click on the '''graph''' link that appears: | |||
<br /> | |||
[[File:Item with graph link.png|Item with graph link]] | |||
<br /> | |||
Starring it [[File:Alert star.png|Alert star]] you make sure you know which alert you read when come back to the summary. | |||
<br /> | |||
[[File:Graph view alert tooltip.png|1200px|Graph view alert tooltip]] | |||
<br /> | |||
The graph will show with a thin vertical line all the alerts associated with the test, so you need to make sure you’re looking at the right one by hovering or clicking on the datapoint. If the datapoint of the improvement/regression is not clear you might want to: | |||
* zoom by drawing a rectangle over the desired area | |||
* zoom out by clicking on the top graph | |||
* extend the timeframe of the graph using the dropbox on the top of the page. | |||
<br /> | |||
If the commit of the improvement/regression is not clear, take the desired action (usually Retrigger/Backfill) and make sure you write down in the notes of the alert ('''Add/Edit notes''') your name and what you did, so you or another colleague know what’s happening next time the alert is sheriffed. The pattern is: ''[yourname] comments''. We use to leave most recent comments first so we can easily read them when we come back.<br /> | |||
[[File:Alert summary add notes.png|1200px|Alert summary add notes]] | |||
<br /> | |||
A clear improvement/regression appears usually when there is easily noticeable difference between two adjacent data points: | |||
<br /> | |||
Revision as of 14:37, 21 January 2020
Context
Identifying the current firefox release meta-bug
To easily track all the regressions opened, for every Firefox release is created a meta-bug that will depend on the regressions open.

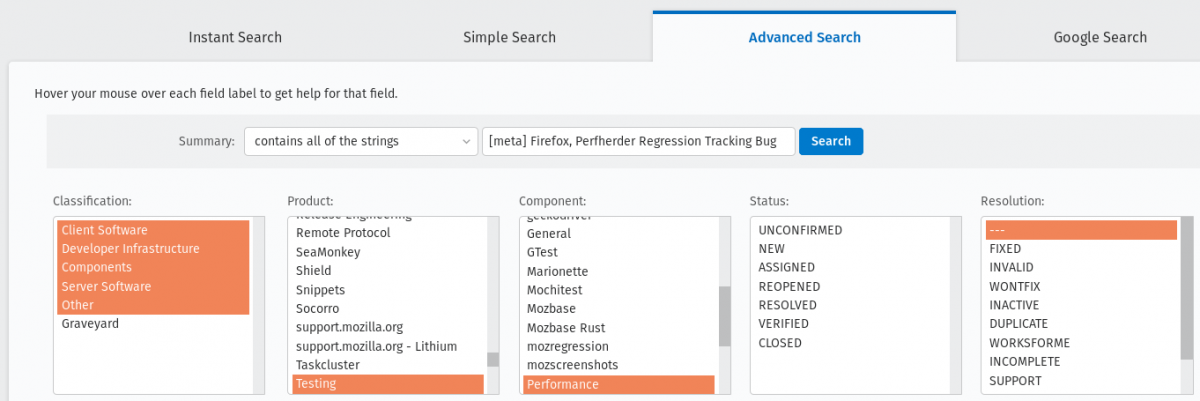
To find all the Firefox release meta-bugs you just have to search in Advanced search for bugs with:

Product: Testing
Component: Performance
Summary: Contains all of the strings [meta] Firefox, Perfherder Regression Tracking Bug
You can leave the rest of the fields as they are.
Searching for an already opened regression
Sometimes treeherder include alerts related to a test in the same summary, sometimes it doesn’t. To make sure that the regression you found doesn’t have already a bug open, you have to search in the current Firefox release meta-bug for regressions open with the summary similar to the summary of your alert. Usually, if the test name matches, it might be what you’re looking for. But, be careful, if the test name matches that doesn’t mean that it is what you’re looking for. You need to check it thoroughly.
Those situations appear because a regression appears first on one repo (e.g. autoland) and it takes a few days until the causing commit gets merged to other repos (inbound, beta, central).
Noisy tests
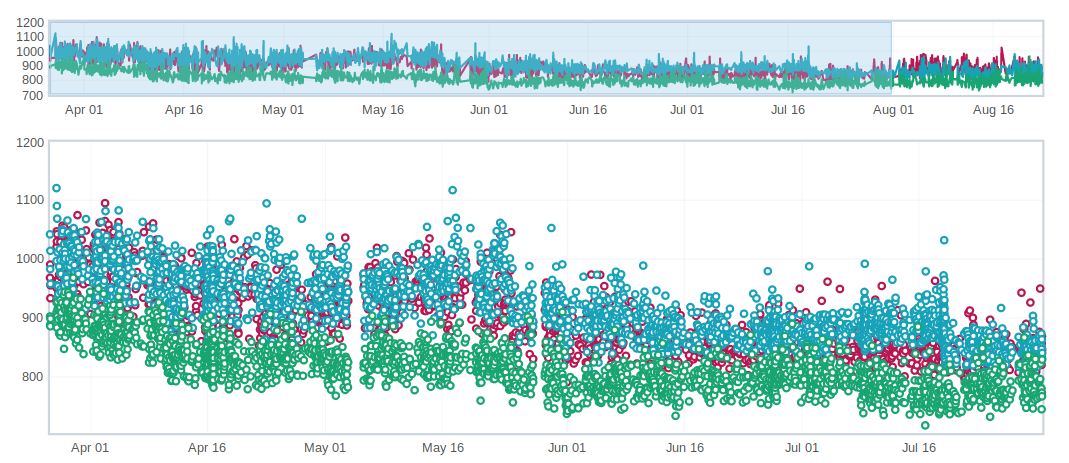
Noisy test are unstable test whose values vary on a wide range and there’s not a clear point in the graph showing where the regression appeared. In general, these tests are not practical to investigate.

Low value tests
Tests whose bugs often end up as WONTFIX/INVALID or tests which are often considered unreliable, not relevant to current Firefox revision etc.
Filtering and reading the alerts
First thing after accessing the Perfherder alerts page is to make sure the filter is set to show the correct alerts you need to sheriff. The new alerts can be found in untriaged.

The Hide… buttons are meant to reduce the visual pollution in case you don’t want to see the improvements or downstream/reassigned/invalid alerts.
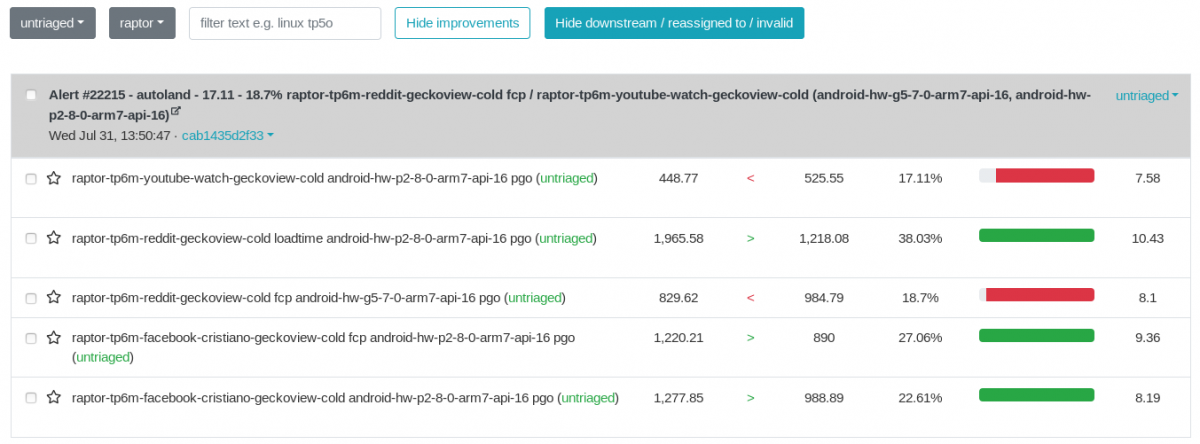
The alerts are grouped by Summaries*. The tests:
- may run on different platforms (e.g. Windows, Ubuntu, android, etc.)
- can share the same suite (e.g. tp6m)
- share the same framework (e.g. raptor, talos): if a particular commit trigger alerts from multiple frameworks, there will be different summaries for every framework.
- measure various metrics (e.g. FCP, loadtime), but not all of the metrics trigger alerts
*By the book, an alert is one item of the summary, but we can refer also to a summary as an alert, depending on the context.
Though you can see in the summary items references to those namings, like below.

Ideally, the intent of every patch landed to the mozilla repositories is to cause improvements, but in the real world it doesn’t happen like that. An alert summary can contain improvements, regressions or both.
- the improvements are marked with green
- and the regressions are marked with red.

In terms of organizing the workflow, we should always prioritise the regressions over improvements.
How to read the graph
Before doing any investigation, you should assign the alert to yourself by clicking on ![]() as described in Updating alerts’ status section.
as described in Updating alerts’ status section.
To read the graph of a certain alert, you just need to put the mouse over it and click on the graph link that appears:

Starring it ![]() you make sure you know which alert you read when come back to the summary.
you make sure you know which alert you read when come back to the summary.
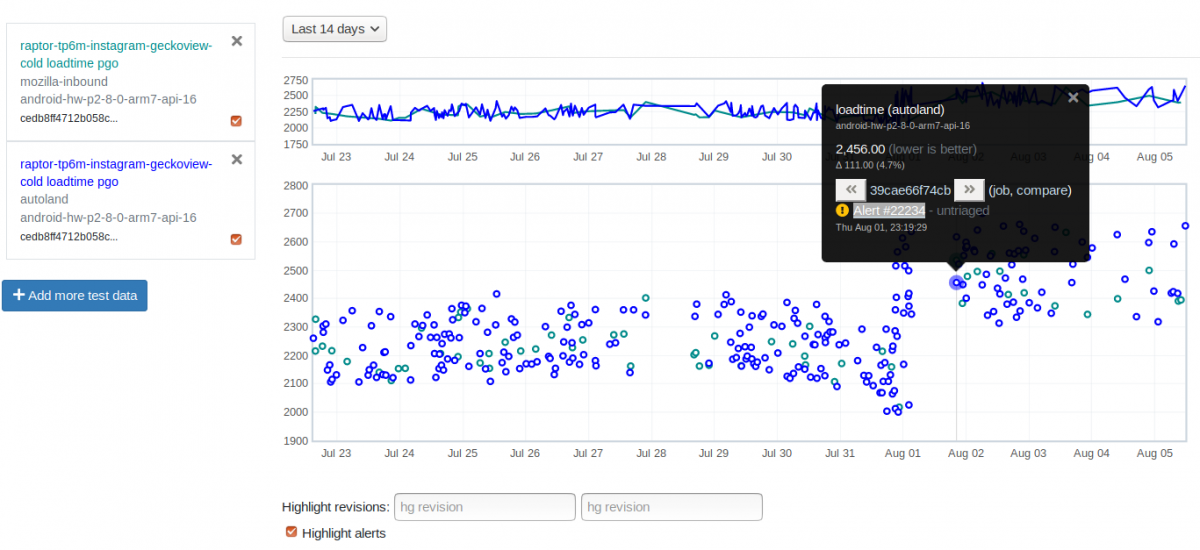
The graph will show with a thin vertical line all the alerts associated with the test, so you need to make sure you’re looking at the right one by hovering or clicking on the datapoint. If the datapoint of the improvement/regression is not clear you might want to:
- zoom by drawing a rectangle over the desired area
- zoom out by clicking on the top graph
- extend the timeframe of the graph using the dropbox on the top of the page.
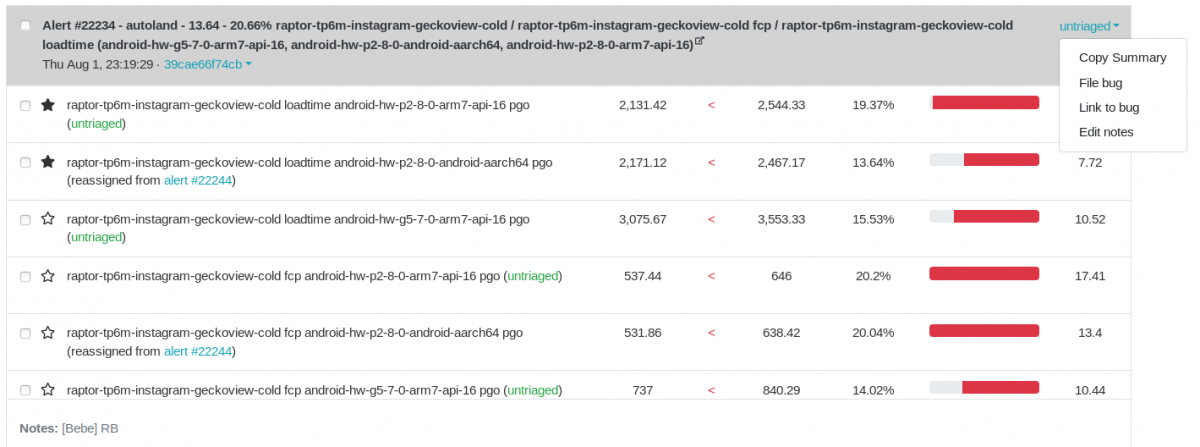
If the commit of the improvement/regression is not clear, take the desired action (usually Retrigger/Backfill) and make sure you write down in the notes of the alert (Add/Edit notes) your name and what you did, so you or another colleague know what’s happening next time the alert is sheriffed. The pattern is: [yourname] comments. We use to leave most recent comments first so we can easily read them when we come back.
A clear improvement/regression appears usually when there is easily noticeable difference between two adjacent data points:

