B2G/QA/2014-10-31 Performance Acceptance
2014-10-31 Performance Acceptance Results
Overview
These are the results of performance release acceptance testing for FxOS 2.1, as of the Oct 31, 2014 build.
Our acceptance metric is startup time from launch to visually-complete, as metered via the Gaia Performance Tests, with the system initialized to make reference-workload-light.
For this release, there are two baselines being compared to: 2.0 performance and our responsiveness guidelines targeting no more than 1000ms for startup time.
The Gecko and Gaia revisions of the builds being compared are:
2.0:
- Gecko: mozilla-b2g32_v2_0/82a6ed695964
- Gaia: 7b8df9941700c1f6d6d51ff464f0c8ae32008cd2
2.1:
- Gecko: mozilla-b2g34_v2_1/50d48f9a04c7
- Gaia: f89c7b12c36572262c9ea76058694a139b1a8634
Note when comparing to past reports that the test timings changed with Bug 1079700 and a handful of subsequent followups. The last report also noted this, as it affected the 2.1 timings.
At the time, it was thought that the 2.0 timings were a control, but we found that the patch actually did not fix 2.0. All fixes on both branches are now in place, hence faster 2.0 timings than previously noted. These faster 2.0 timings mean that the lower numbers in the last study probably are largely due to the timing changes. However, they are also likely more accurate.
This initial report has a limited (390 maximum) data point set for 2.0. It will be updated with full results for future baselines and any notable differences (unlikely) will be communicated.
Startup -> Visually Complete
Startup -> Visually Complete times the interval from launch when the application is not already loaded in memory (cold launch) until the application has initialized all initial onscreen content. Data might still be loading in the background, but only minor UI elements related to this background load such as proportional scroll bar thumbs may be changing at this time.
This is equivalent to Above the Fold in web development terms.
More information about this timing can be found on MDN.
Execution
These results were generated from 480 application data points per release, generated over 16 different runs of make test-perf as follows:
- Flash to base build
- Flash stable FxOS build from tinderbox
- Constrain phone to 319MB via bootloader
- Clone gaia
- Check out the gaia revision referenced in the build's sources.xml
- GAIA_OPTIMIZE=1 NOFTU=1 make reset-gaia
- make reference-workload-light
- For up to 16 repetitions:
- Reboot the phone
- Wait for the phone to appear to adb, and an additional 30 seconds for it to settle.
- Run make test-perf with 31 replicates
Result Analysis
First, any repetitions showing app errors are thrown out.
Then, the first data point is eliminated from each repetition, as it has been shown to be a consistent outlier likely due to being the first launch after reboot. The balance of the results are typically consistent within a repetition, leaving 30 data points per repetition.
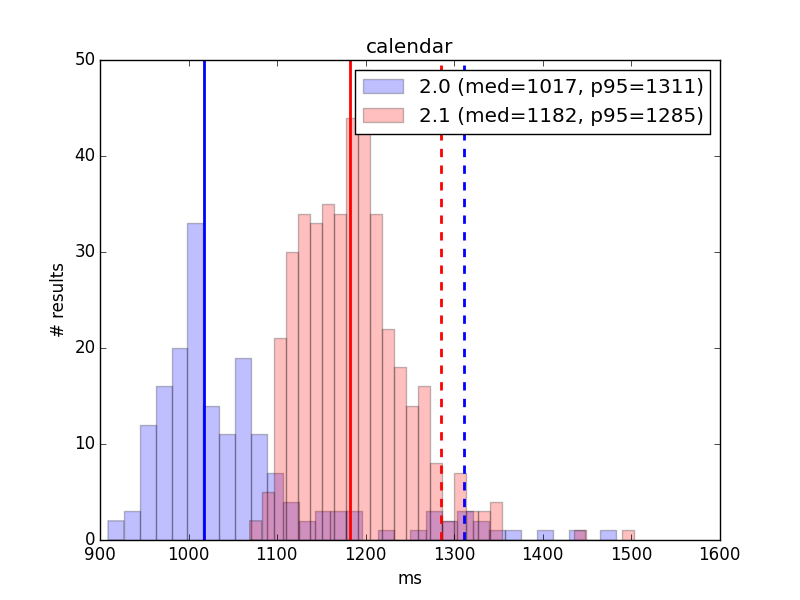
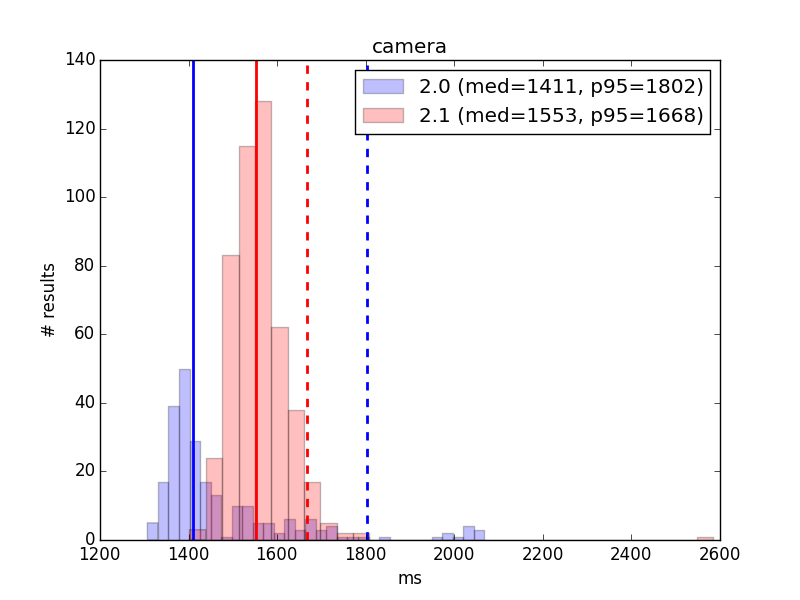
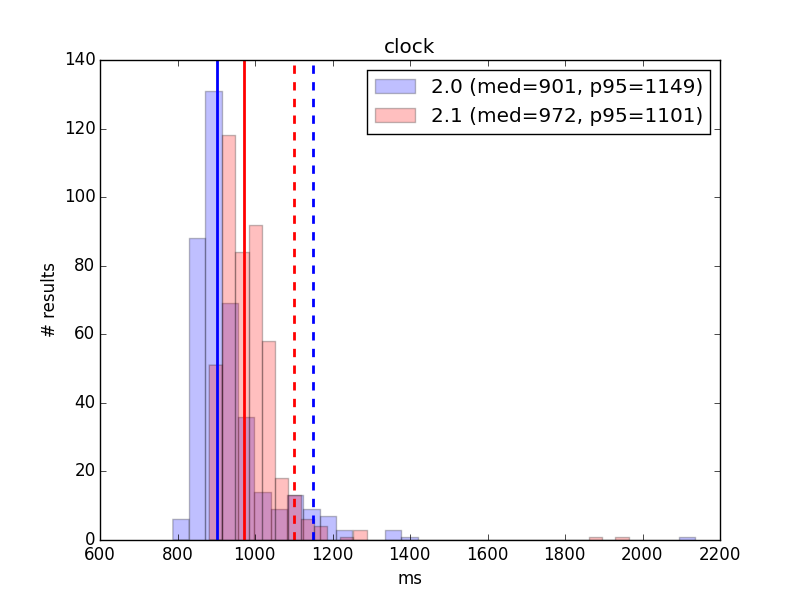
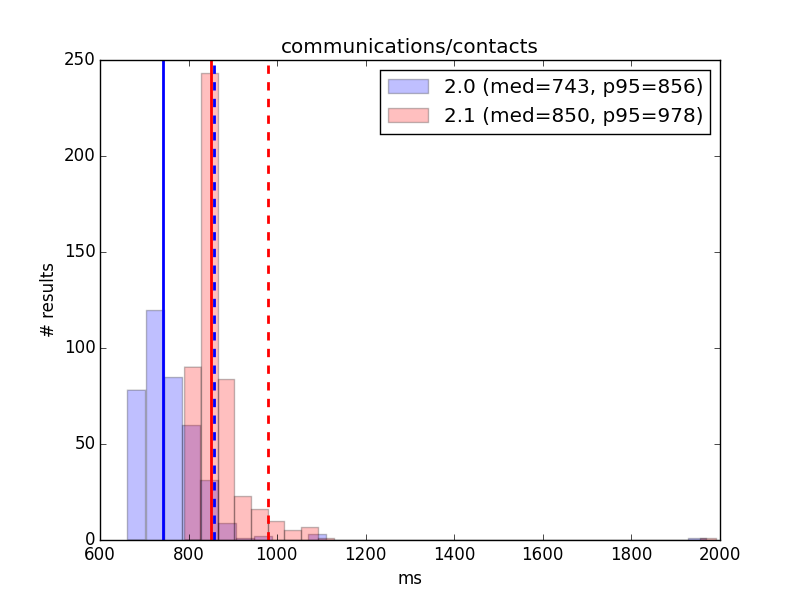
These are combined into a large data point set. Each set has been graphed as a 32-bin histogram so that its distribution is apparent, with comparable sets from 2.0 and 2.1 plotted on the same graph.
For each set, the median and the 95th percentile results have been calculated. These are real-world significant as follows:
- Median
- 50% of launches are faster than this. This can be considered typical performance, but it's important to note that 50% of launches are slower than this, and they could be much slower. The shape of the distribution is important.
- 95th Percentile (p95)
- 95% of launches are faster than this. This is a more quality-oriented statistic commonly used for page load and other task-time measurements. It is not dependent on the shape of the distribution and better represents a performance guarantee.
Distributions for launch times are positive-skewed asymmetric, rather than normal. This is typical of load-time and other task-time tests where a hard lower-bound to completion time applies. Therefore, other statistics that apply to normal distributions such as mean, standard deviation, confidence intervals, etc., are potentially misleading and are not reported here. They are available in the summary data sets, but their validity is questionable.
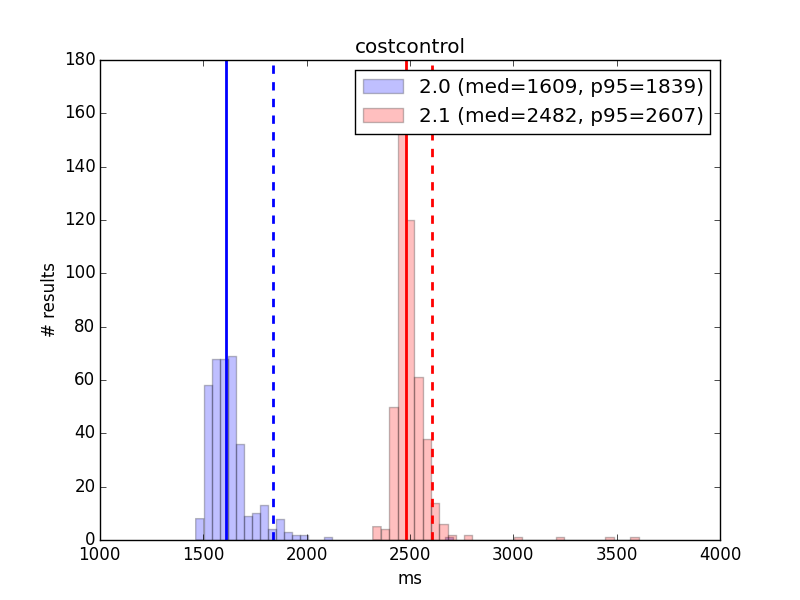
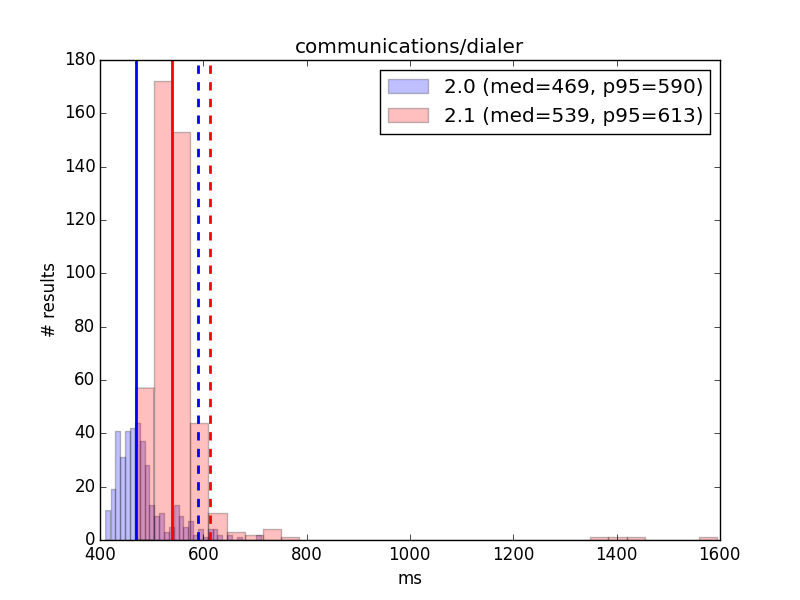
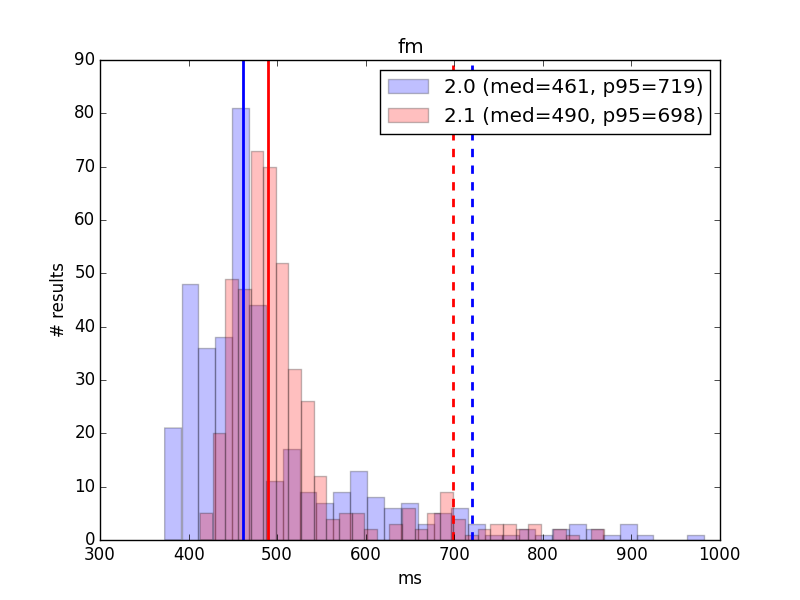
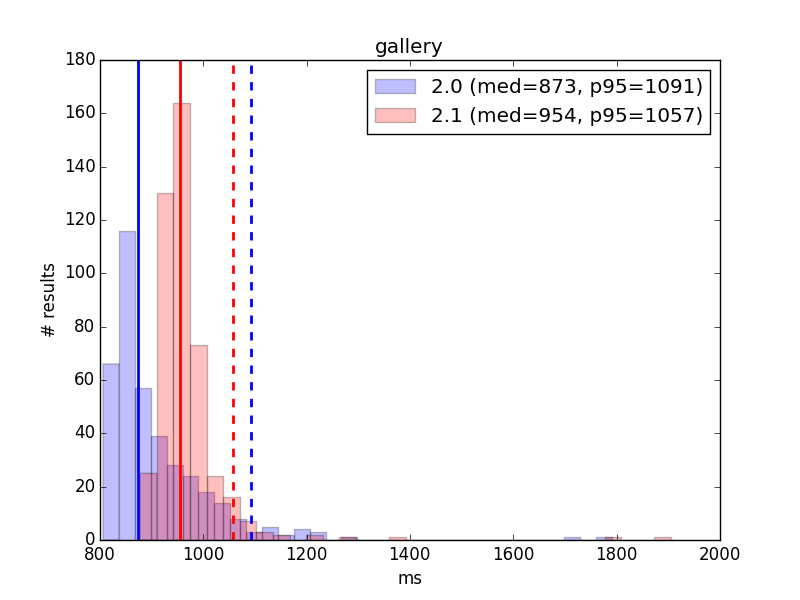
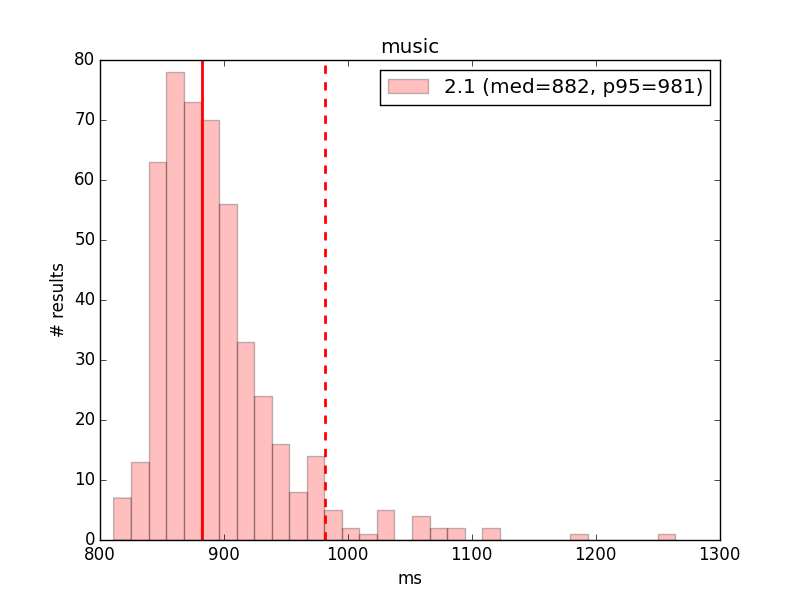
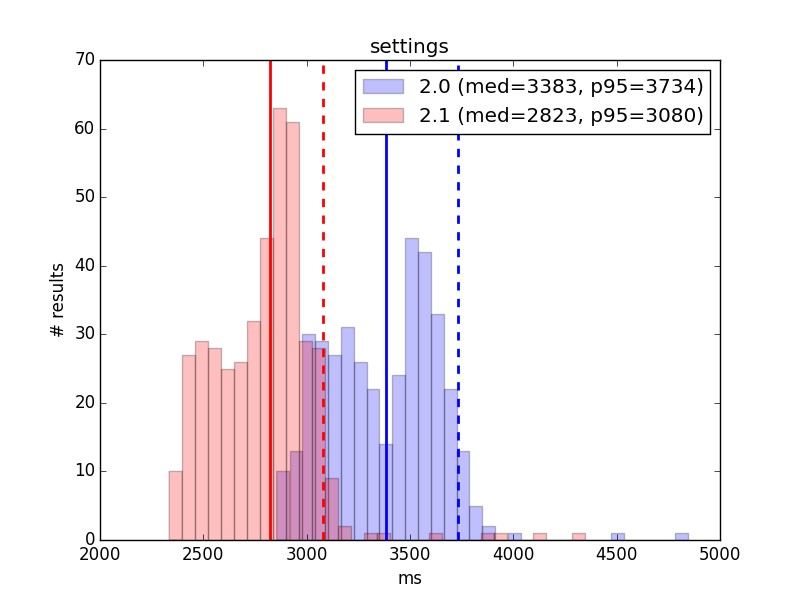
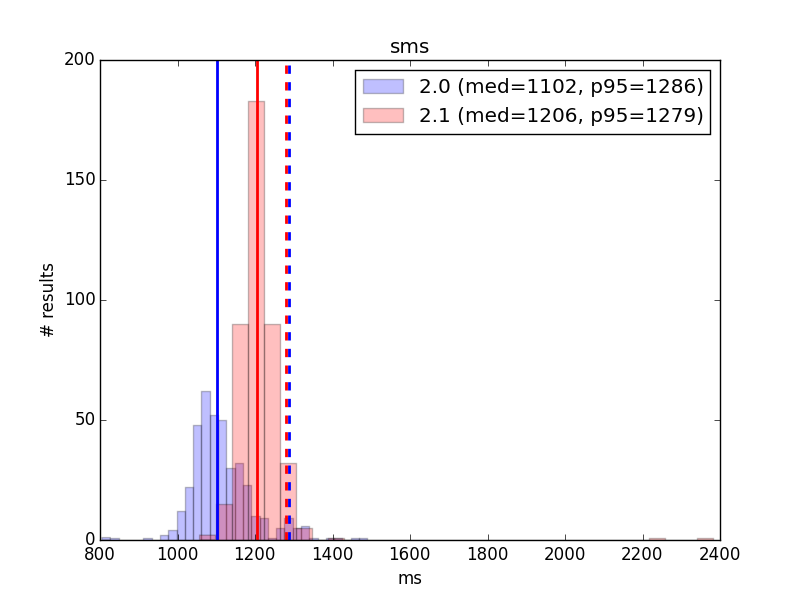
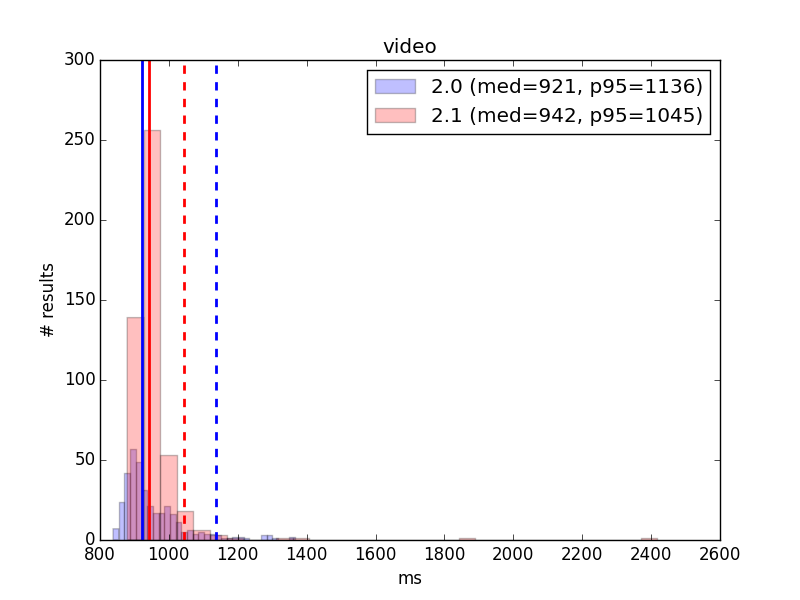
On each graph, the solid line represents median and the broken line represents p95.
Pass/Fail Criteria
Pass/Fail is determined according to our documented release criteria for 2.1. This boils down to launch time being under 1000 ms.
Median launch time has been used for this, per current convention. However, as mentioned above, p95 launch time might better capture a guaranteed level of quality for the user. In cases where this is significantly over 1000 ms, more investigation might be warranted.
Results
Calendar
2.0
- 180 data points
- Median: 1017 ms
- p95: 1311 ms
2.1
- 420 data points
- Median: 1182 ms
- p95: 1285 ms
Result: FAIL (small regression, over guidelines)
Comment: Results are largely unchanged since 10-20. They remain slightly worse than 2.0 and over the 1000 ms target.
Camera
2.0
- 240 data points
- Median: 1411 ms
- p95: 1802 ms
2.1
- 480 data points
- Median: 1553 ms
- p95: 1668 ms
Result: FAIL (over guidelines)
Comment: 2.1 results are slightly slower than the 10-20 comparison (~30 ms), but are close enough to possibly be within margin of error. As mentioned previously, though on paper the 2.1 results are slower than 2.0, the timing is actually different between branches and 2.1 is actually slightly faster.
Clock
2.0
- 390 data points
- Median: 901 ms
- p95: 1149 ms
2.1
- 450 data points
- Median: 972 ms
- p95: 1101 ms
Result: PASS
Comment: 2.1 results are slightly faster (~25 ms) than in the last comparison, but any improvement is arguably within margin of error.
Contacts
2.0
- 390 data points
- Median: 743 ms
- p95: 856 ms
2.1
- 480 data points
- Median: 850 ms
- p95: 978 ms
Result: PASS
Comment: Results are fundamentally unchanged from the last comparison.
Cost Control
2.0
- 360 data points
- Median: 1609 ms
- p95: 1839 ms
2.1
- 480 data points
- Median: 2482 ms
- p95: 2607 ms
Result: FAIL (over guidelines, large regression)
Comment: Cost Control debuts in this comparison with times well over the target 1000 ms and with a large regression from 2.0. Investigation in bug 1072621 has shown that this test only measures the first time the Usage app is run, where it runs through its own First Time Use flow; it was determined there that subsequent cold launches are significantly faster.
Dialer
2.0
- 390 data points
- Median: 469 ms
- p95: 590 ms
2.1
- 450 data points
- Median: 539 ms
- p95: 613 ms
Result: PASS
Comment: Results are fundamentally the same as in the last comparison.
FM Radio
2.0
- 390 data points
- Median: 461 ms
- p95: 719 ms
2.1
- 450 data points
- Median: 490 ms
- p95: 698 ms
Result: PASS
Comment: 2.1 results are slightly improved from the last comparison, but possibly within margin of error.
Gallery
2.0
- 390 data points
- Median: 873 ms
- p95: 1091 ms
2.1
- 450 data points
- Median: 954 ms
- p95: 1057 ms
Result: PASS
Comment: Results are fundamentally identical to the last comparison.
Music
2.1
- 480 data points
- Median: 882 ms
- p95: 981 ms
Result: PASS
Comment: Music shows a slight slide from the last comparison (~35 ms). However, this is small enough to possibly be within margin of error.
Settings
2.0
- 390 data points
- Median: 3383 ms
- p95: 3734 ms
2.1
- 420 data points
- Median: 2823 ms
- p95: 3080 ms
Result: FAIL (over guidelines)
Comment: Settings has improved significantly from its previous slow point of 3131 ms on 10-20. It is not, however, back to the 2577 ms of the 10-02 comparison. The 2.0 results remain bimodal, and are unchanged even with fixed timing code applied to the branch.
SMS
2.0
- 390 data points
- Median: 1102 ms
- p95: 1286 ms
2.1
- 420 data points
- Median: 1206 ms
- p95: 1279 ms
Result: FAIL (over guidelines, regression)
Comment: The 2.1 results for SMS are very similar to the last comparison, within margin of error. The improved timing code on 2.0, however, makes it clear that there is a regression from that branch (measured at ~100 ms).
Video
2.0
- 360 data points
- Median: 921 ms
- p95: 1136 ms
2.1
- 480 data points
- Median: 942 ms
- p95: 1045 ms
Result: PASS
Comment: Results are fundamentally the same as in the last comparison.
Raw Data
Will be added after full dataset is updated.
