DevTools/OperationInstrument
Operation Instrument is a project that aims to add tracing instrumentation to Gecko and provide a holistic view of where time is being spent and why.
Examples of traced operations include:
- Style Recalculation
- Layout
- Painting
- JavaScript run-to-completion
- HTML parsing
- Etc...
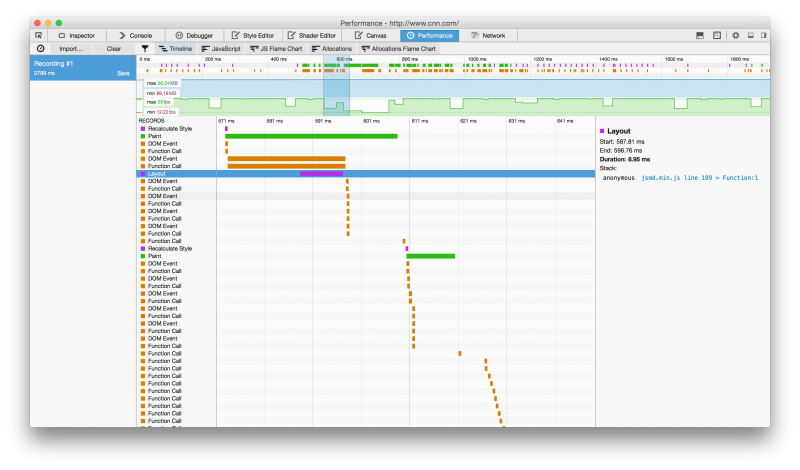
The traced operations are displayed in the DevTools Performance tool's timeline.
This is a meta bug for tracking instrumentation: (operation-instrument) Instrument Gecko w/ moar timeline markers
You can contribute to Operation Instrument by adding more instrumentation!
What is a good candidate for tracing? Any single operation that can take more than a millisecond of time is a good rule of thumb. Parsing HTML is a good example because it can easily take tens of milliseconds or even longer on really big HTML snippets. Flattening a JS rope string is not as good an example, because while it may take up a lot of time in aggregate over a period of time, each individual flattening should be much faster than a millisecond.
Tutorial: Instrumenting New Operations
The Firefox performance tool breaks down Gecko operations into labeled chunks of time, displayed as a waterfall. Each of these chunks is registered by the platform with a pair of markers. A marker for when the operation starts, and a marker for when the operation ends. To add a new type of marker pair, (1) add the instrumentation at the Gecko platform level, and (2) provide some minimal configuration on the devtools frontend side.
This is a good example bug, to see what adding new instrumentation is like: Bug 1151703 - Add profiler timeline markers for HTML/XML parsing — TL;DR it is pretty easy!
1. Adding the Instrumentation to Gecko
Depending on the required fine level of control, there's a couple of ways to do this, and more coming soon. Currently, markers may only be added from the main thread, with plans to support them everywhere in the near future (see otmt-markers bug 1183219).
Using mozilla::AutoTimelineMarker
The easiest way to trace Gecko events/tasks with start and end timeline markers is to use the mozilla::AutoTimelineMarker RAII class. It automatically adds the start marker on construction, and adds the end marker on destruction. Don't worry too much about potential performance impact! It only actually adds the markers when the given docshell is being observed by a timeline consumer, so essentially nothing will happen if a tool to inspect those markers isn't specifically open.
This class may only be used on the main thread, and pointer to a docshell is necessary. If the docshell is a nullptr, nothing happens and this operation fails silently.
Example:
AutoTimelineMarker marker(aTargetNode->OwnerDoc()->GetDocShell(), "Parse HTML");
Using mozilla::AutoGlobalTimelineMarker
Similar to the previous RAII class, but doesn't expect a specific docshell, and the marker will be visible in all timeline consumers. This is useful for generic operations that don't involve a particular dochsell, or where a docshell isn't accessible. May also only be used on the main thread.
Example:
AutoGlobalTimelineMarker marker("Some global operation");
Using TimelineConsumers
A few static methods exist on the TimelineConsumers class, like AddMarkerForDocShell, AddMarkerForDocShellsList, AddMarkerForAllObservedDocShells that give you fine grained control over creating the markers and what meta-data is attached to them.
Example:
TimelineConsumers::AddMarkerToDocShellsList(aDocShells, "Some specific operation", aMetaData);
2. Telling the DevTools Frontend About the New Markers
To get your new markers displayed in the performance tool's UI, edit the configuration data in devtools/client/performance/modules/markers.js.
Add a property to the TIMELINE_BLUEPRINT object. The property key should be the const char * literal that you added in step 1 ("Parse HTML" in our example). The new property should be an object with the following properties:
group: 0, 1, or 2. Controls which line the markers are rendered on in the trace events summary along the top of the performance tool. When in doubt, just use 0 and ask your reviewer.
colorName: The DevTools color that the trace should be rendered as in the UI. Its value should be the string name of a CSS variable from that MDN page, without the leading--prefix.
label: The L10N string name for the marker.
--- a/browser/devtools/shared/timeline/global.js
+++ b/browser/devtools/shared/timeline/global.js
@@ -48,16 +48,26 @@ const TIMELINE_BLUEPRINT = {
     colorName: "highlight-lightorange",
     label: L10N.getStr("timeline.label.javascript2")
   },
+  "Parse HTML": {
+    group: 1,
+    colorName: "highlight-purple",
+    label: L10N.getStr("timeline.label.parseHTML")
+  },
   "ConsoleTime": {
     group: 2,
     colorName: "highlight-bluegrey",
Finally, add a localizable string label for the new marker:
--- a/browser/locales/en-US/chrome/browser/devtools/timeline.properties
+++ b/browser/locales/en-US/chrome/browser/devtools/timeline.properties
@@ -35,16 +35,18 @@ timeline.records=RECORDS
 timeline.label.reflow2=Layout
 timeline.label.paint=Paint
 timeline.label.javascript2=Function Call
+timeline.label.parseHTML=Parse HTML
 timeline.label.domevent=DOM Event
 timeline.label.consoleTime=Console
Any of the people listed here under "Performance" are good candidates to review the devtools config changes.
Adding Custom Metadata to Markers
Under the hood, AutoTimelineMarker is using the TimelineMarker class is defined in docshell/base/TimelineMarker.h. A timestamp and the current JS stack (if any) is recorded when the marker is instantiated. It's also possible to attach additional, arbitrary metadata to a marker by subclassing TimelineMarker.
To display a marker's custom metadata add a rendering function in browser/devtools/timeline/widgets/marker-details.js.
Recording Markers in a Different Thread
For now, it's not supported. Only operations in the main thread are instrumented. Follow https://bugzilla.mozilla.org/show_bug.cgi?id=1152988 to watch for support for markers from different threads.
