Firefox OS/Performance/Investigating Alerts
When you get an email from fxos-perf-alerts@mozilla.com, there is a good chance it is an automated email.
We have two types of automated alerts:
- Ingestion Alerts (we were expecting data and never received it)
- Regression Alerts (the values of the reported data have changed)
Regression Alerts
A regression alert has a Title in this format
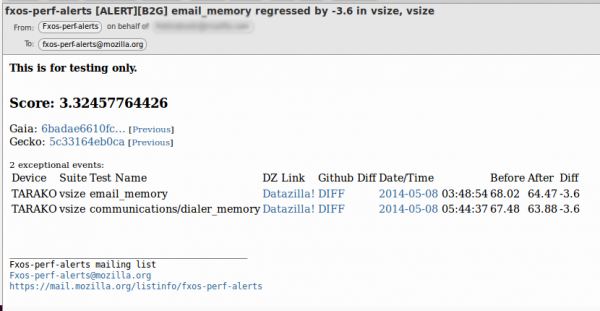
'[ALERT][B2G] <testname> regressed by <-x.x> in <suite>'
example:
Summary
The first part of the Alert is the score:
This score is meant to be abstract representation of how important this alert is compared to the others. There are many factors that go into generating a score:
- The p-value of the test used,
- a multiplier for the type of test (compensating for it's propensity to send false alerts),
- the relative size of the regression, and
- in the case of compound alerts; a mixture of the component alert scores.
Right now, The score currently maps to the p-value of the median test used to detect the regression: score = -log10(p-value). It is currently set to alert when score > 2 (p-value < 0.01), and does not go above 4 (p-value > 0.0001) given the current window size.
The next section gives you direct links to the code that built B2G used for this test.
The gaia revision is a link to github that shows the specific changes to gaia.
The gecko revision is a link to github showing the current revision of gecko that we are using. bug 1010384 tracks getting these links to work.
Detailed Regressions
The last section of the alert is the details of the regression. For the given build, there could be many regressions found, we will list all of them in this section.
Device type
We outline which device model is used. The example here is Tarako, Other values are Hamachi as well.
Suite
After the device we mention what suite showed a regression. In this example we have 'vsize' as the suite:

The suite will be from one of two harnesses:
- [b2gperf]
- possible values are: contacts, messages, settings, gallery, video, music, email, browser, homescreen, camera, phone, calendar, clock, fm radio, usage, template
- [make perf-test]
- possible values are: pss, rss, system_pss, system_rss, system_uss, system_vsize, uss, vsize
Testname
Next is the testname that was run inside of the suite. In this example we have 'email_memory':

The test name is also dependent upon the suite and is from one of two harnesses:
- [b2gperf]
- possible values are: cold_load_time, fps
- [make perf-test]
- possible values are: communications/contacts_memory, communications/dialer_memory, communications/ftu_memory, email_memory, settings_memory
Datazilla links
The next section is the Datazilla links, these are mostly self explanatory and for more information on what the view in Datazilla means, check out Bisecting Regressions:
Link to diff
After the links to Datazilla, we show a link to a diff of the Gaia repository (all changes from the previous test run to the current one):

Date of regression
The next field is the date. This is the date that the results were posted to Datazilla. Not the date we did the build or started the test run. Not the date that we detected the regression. Since the alerting system waits for future data, this date will be a few hours older than the email:

Raw Numbers
The last section of the details is the raw numbers for Before, After, and Diff:

* Before - the MEAN value of the previous 10 data points you see on the Datazila graph
* After - the MEAN value of the current data point + 9 future ones which are seen on the Datazilla graph
* Diff - After - Before


