Socorro/Debugging Minidumps
This page is designed to aid in loading and viewing a Microsoft minidump file in Visual Studio. It is highly recommended to use Visual Studio 2010 or later, because it is much easier to configure the symbol paths.
Contents
Getting crash-stats.mozilla.com Minidump Access
For each crash report on crash-stats.mozilla.com, the system stores the submitted minidump file. Because this file contains a dump of stack memory, it may contain potentially private information. access to the minidumps requires special LDAP privileges "cn=CrashReportsRawDumpAccess,ou=groups,dc=mozilla". This is currently only available to Mozilla Corporation employees with approval from Benjamin Smedberg and their manager. Please file an IT request.
Downloading the Minidump File
- When viewing an individual report in crash-stats, click the "Log In" button in the lower-right corner.
- Go to the "Raw Dump" tab and there should be a link to the raw dump
- Save this file to your local computer with the extension .dmp (not .dump or Visual Studio won't recognize it)
Getting the Matching Binaries
In order to view a minidump, Visual Studio wants access to the matching binaries. You should check the Firefox version/buildid listed in the crash report and download the matching build from ftp: Nightly, Aurora, and Beta builds, recent releases, all releases. The dated directories for nightly/aurora match the build IDs. For beta builds, check the .txt file to make sure that the build IDs match.
Run the installer in custom mode, putting the install in a special location for debugging. bsmedberg uses this scheme:
- download minidump to c:\builds\debugging-builds\ff-version-buildid\bug#-crashid.dmp
- download build to c:\builds\debugging-builds\ff-version-buildid\firefox-installre.exe
- install build to c:\builds\debugging-builds\ff-version-buildid\installed
Load the Minidump
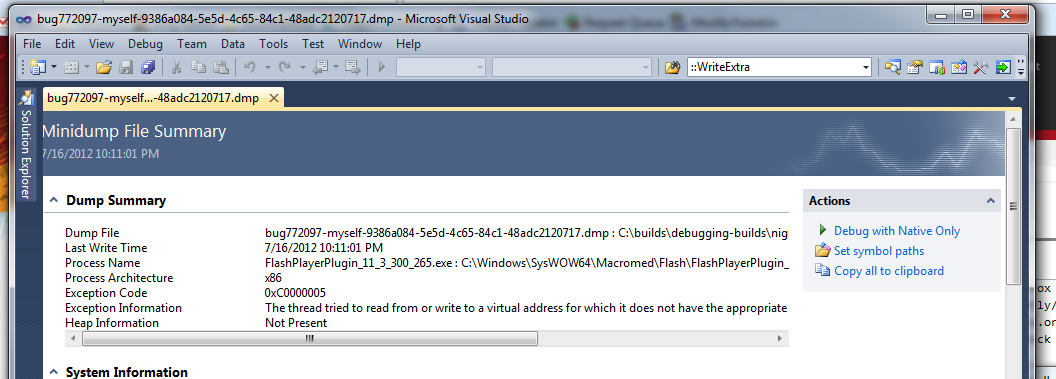
Load the minidump using "Open File" from visual studio 2010. You should see this screen:
Symbols
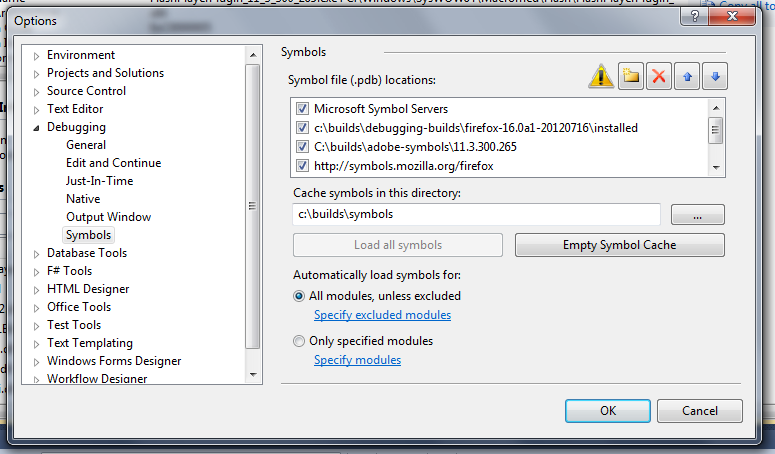
Choose the "Set symbol paths" option from the minidump screen (upper right). You should enable the Microsoft symbol server. PDB files for try, nightly, aurora, beta, and release builds are all available via the Mozilla symbol server.
If the minidump is a Flash minidump, Mozilla Corporation employees also have access to obfuscated PDB files for Flash releases. Please contact bsmedberg or ted for instructions.
You will need to add the install location of the matching build to the Visual studio symbol search path.
Minidump Debugging
Crash minidumps usually contain the following information:
- crash reason and address
- module list and load addresses (DLLs and EXEs)
- stack memory sections for each thread
Minidumps do not contain the full heap.
In most cases the debugger will be able to display a correct stacktrace, although stack walking is not always accurate. The register information will be correct when viewing the top frame of the crash, but may be incorrect or incomplete for earlier frames; if stalk walking is accurate, at least ESP, EBP and EIP will be correct for most stack frames. Local variable display may not be correct and should be viewed with suspicion. When in doubt, you can view the disassembly for a frame to deduce in what location/register a local variable is stored.

