Drumbeat/Challenges/Visualize the Web
In a nutshell: Visualize the Web uses art, design and data to map the internet -- to help all of us understand the web, how it works and what it means.
At this stage, Visualize the Web is just an idea under the Mozilla Drumbeat umbrella. If you want to help, add your name and contact info below. We'll be in touch.
Objectives
- Transform the big, abstract internet into something simple and emotional that busy people can understand by ...
- Building a community of artists, designers and data nerds passionate about mapping the internet who ...
- Create lasting tools and maps that help people understand how the internet works and where they fit in.
- Over time: use the insights from these maps to generate other kinds of tools and projects that make the web better, and more open.
Lee: how does this fit w/ Pew's motivations? What would you add? What would you take away?
The Idea
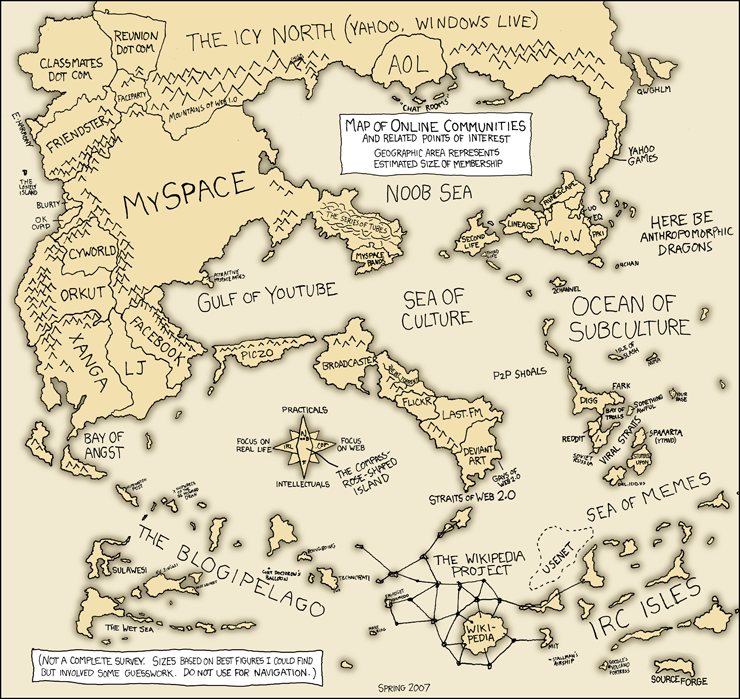
The web. Huge, and uncharted.
More than a billion people use the web – for business, for school, for friendship, to express themselves, to love. Despite the importance of the web in our lives, few of us understand how it works. It big, pervasive, complicated. And there are no good maps.
It's time to make some maps -- together.
Visualize the Web (needs better name) is about mapping the web -- using data and design to help us understand the internet and where we each fit in.
As a starting point: artists, designers, data nerds and everyday internet users are invited to propose ideas for visualizing the web. These could be literal and insightful. Or playful and thought provoking. The only constraint: use real (public and anonymous) data to tell a story about how it the internet works and what it means.
From there, we roll up our sleeves: working together to make the best design ideas real. Building maps that we can use and update over time to see the living internet, and to help make it better and more open.
Possible Activities
Building on the spirit of Mozilla Drumbeat, the idea is a) create opportunities for many people to participate in b) creating useful and lasting tools that help internet users understand the web. Possible steps along the way:
- Open ended design challenge where people sketch maps and data visualizations they'd like to see created.
- As a constraint, you probably want people to point to (or at least notionally explain) data sets that would make their visualization possible.
- Could be as simple as creative ways of communicating information already coming from places like Pew.
- Crowdsourced detective project to list and assess already publicly available data that would help us to better tell the story of the web.
- Simple example: data sources behind Internet World Stats
- Building out the 'low hanging fruit' maps based on the design challenge and easily available data sets.
- This is a combination of design and technical work. Idea would be to build a community to do all or most of it.
- Use this as a chance to demo interesting new open web tech -- eg. could do a bunch of this using processing.js if we could get the right developers.
- Also, identify a small set of maps and visualizations that can serve as an Internet Health (or Openness) Monitor. Invest in building these as something that can be maintained and used over time.
- Gap filling effort: identifying places where we don't know what the internet looks like, and finding ways to map this.
Lee: you've probably got a whole other set of ideas here. Please add.
Inspiration
Here are some examples of using data to visualize and explain the internet:
- Compilation of Web info graphics
- John Slater's dataviz bookmarks
- Akami web usage visualizations
- TwittEarth
What we want is more of this, plus a focus on generating specific insights (e.g. where is the web most open vs. most closed?).
People who are interested
- Lee Rainie, Pew Internet
- Mark Surman, Mozilla
- ....
People to talk to
- Chris Messina (originally suggested something like this)
- Nathan Yau, the guy behind Flowing Data
- Lauren Cornell at Rhizome
- Clay Shirkey -- does he have students who might be interested in this project
- People at the Web Foundation
- Free Press?
- Berkman?
- CitizenLab at UofT?
- ...
Questions
- What's a good title for this? Something that captures both the data analysis and visual side of what we're doing.
- What guidelines do we need in place that we're genuinely using anonymous and public data? Who is a good person to lead this side of things?
- Who is already doing stuff like this? Is there anyone obvious to step up and take a lead? If so, we could back them.
- Are there Pew equivalents outside the US that we can reach out to and involve in this project?
=Timeline
It's too early to really say. We'll do a first call in December (below) and develop a basic roadmap by early January. We'll could do a simple design challenge on the Drumbeat site as early as February.
Get involved
If you'd like to get involved, add your name above or introduce yourself on the Mozilla Drumbeat mailing list.
Also, as a starting point, we'll be doing a brainstorming and planning call on December x at y. This is a public call and anyone can join. The dial in info is here: