B2G/QA/2014-11-07 Performance Acceptance
2014-11-07 Performance Acceptance Results
Overview
These are the results of performance release acceptance testing for FxOS 2.1, as of the Nov 07, 2014 build.
Our acceptance metric is startup time from launch to visually-complete, as metered via the Gaia Performance Tests, with the system initialized to make reference-workload-light.
For this release, there are two baselines being compared to: 2.0 performance and our responsiveness guidelines targeting no more than 1000ms for startup time.
The Gecko and Gaia revisions of the builds being compared are:
2.0:
- Gecko: mozilla-b2g32_v2_0/82a6ed695964
- Gaia: 7b8df9941700c1f6d6d51ff464f0c8ae32008cd2
2.1:
- Gecko: TBA
- Gaia: TBA
Startup -> Visually Complete
Startup -> Visually Complete times the interval from launch when the application is not already loaded in memory (cold launch) until the application has initialized all initial onscreen content. Data might still be loading in the background, but only minor UI elements related to this background load such as proportional scroll bar thumbs may be changing at this time.
This is equivalent to Above the Fold in web development terms.
More information about this timing can be found on MDN.
Execution
These results were generated from 480 application data points per release, generated over 16 different runs of make test-perf as follows:
- Flash to base build
- Flash stable FxOS build from tinderbox
- Constrain phone to 319MB via bootloader
- Clone gaia
- Check out the gaia revision referenced in the build's sources.xml
- GAIA_OPTIMIZE=1 NOFTU=1 make reset-gaia
- make reference-workload-light
- For up to 16 repetitions:
- Reboot the phone
- Wait for the phone to appear to adb, and an additional 30 seconds for it to settle.
- Run make test-perf with 31 replicates
Result Analysis
First, any repetitions showing app errors are thrown out.
Then, the first data point is eliminated from each repetition, as it has been shown to be a consistent outlier likely due to being the first launch after reboot. The balance of the results are typically consistent within a repetition, leaving 30 data points per repetition.
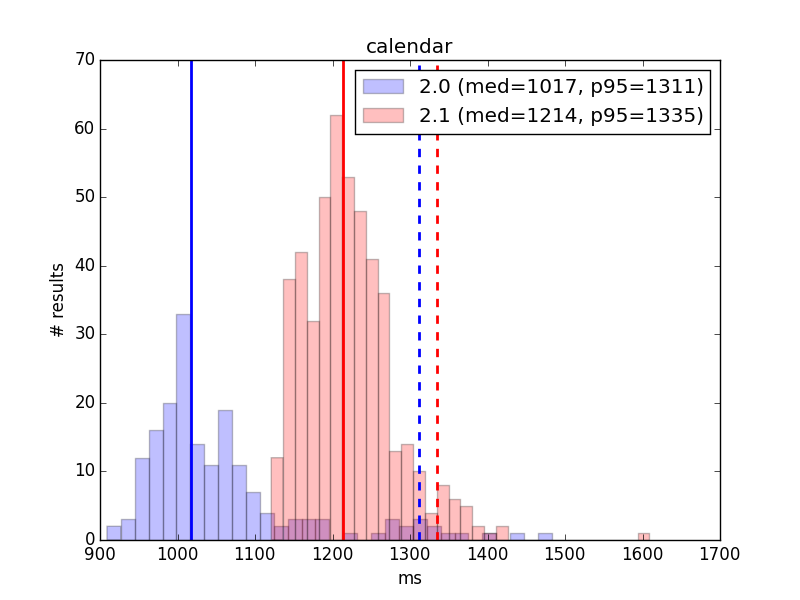
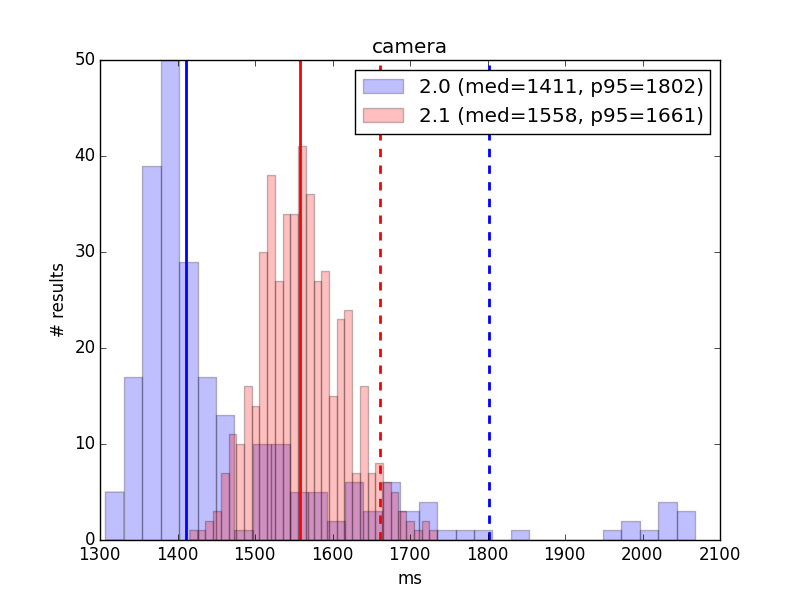
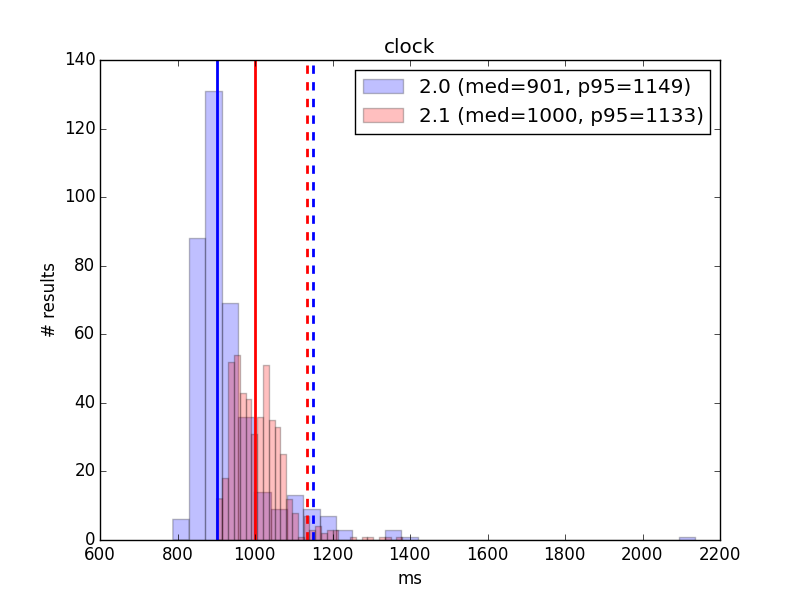
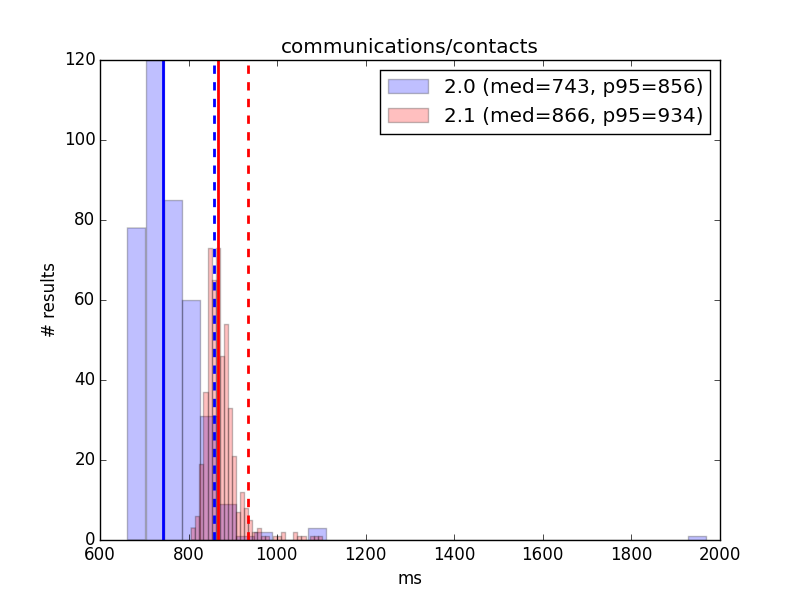
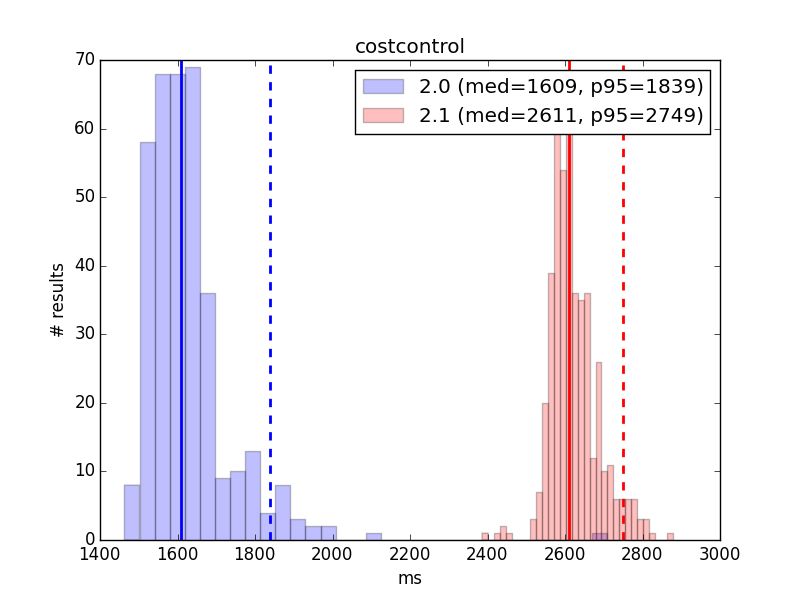
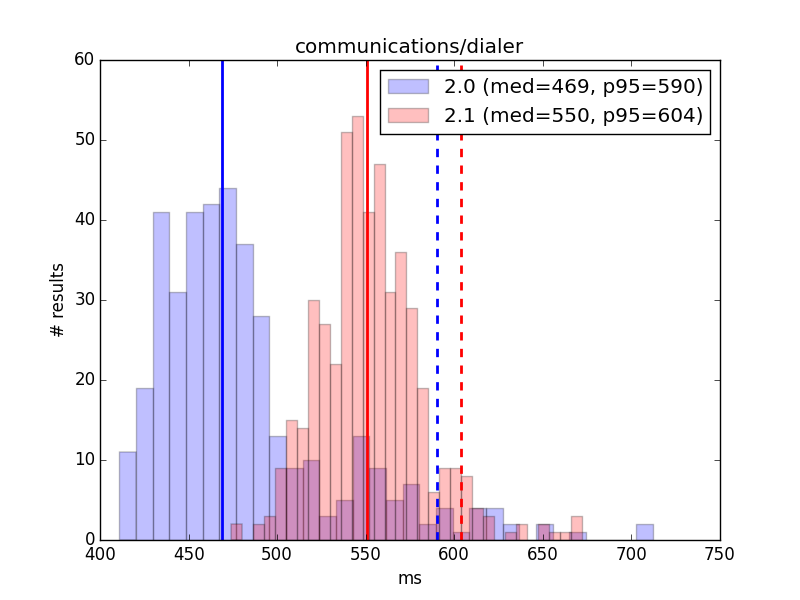
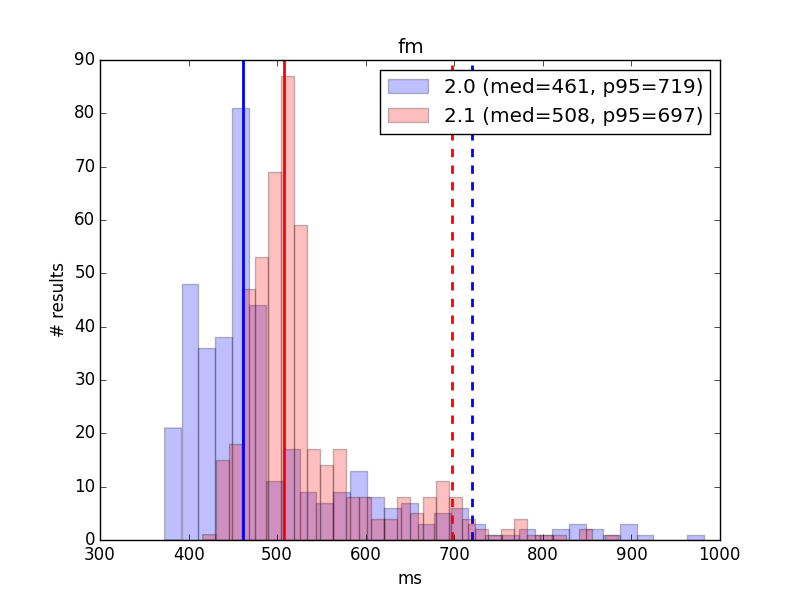
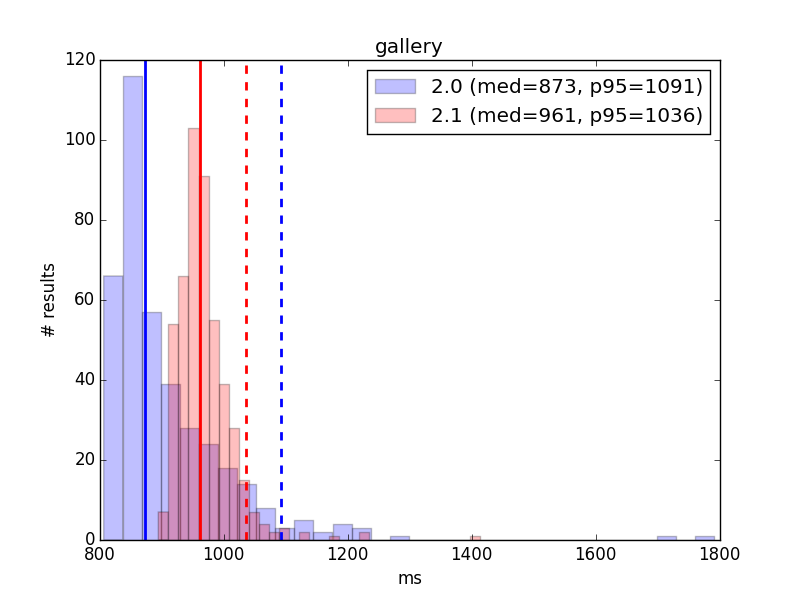
These are combined into a large data point set. Each set has been graphed as a 32-bin histogram so that its distribution is apparent, with comparable sets from 2.0 and 2.1 plotted on the same graph.
For each set, the median and the 95th percentile results have been calculated. These are real-world significant as follows:
- Median
- 50% of launches are faster than this. This can be considered typical performance, but it's important to note that 50% of launches are slower than this, and they could be much slower. The shape of the distribution is important.
- 95th Percentile (p95)
- 95% of launches are faster than this. This is a more quality-oriented statistic commonly used for page load and other task-time measurements. It is not dependent on the shape of the distribution and better represents a performance guarantee.
Distributions for launch times are positive-skewed asymmetric, rather than normal. This is typical of load-time and other task-time tests where a hard lower-bound to completion time applies. Therefore, other statistics that apply to normal distributions such as mean, standard deviation, confidence intervals, etc., are potentially misleading and are not reported here. They are available in the summary data sets, but their validity is questionable.
On each graph, the solid line represents median and the broken line represents p95.
Result Criteria
After taking feedback on past studies, I'm handling the result criteria a little differently.
Rather than Pass/Fail, I'm listing whether or not the result is OVER or UNDER the listed target in the documented release acceptance criteria.
To be OVER or UNDER, the result must vary by at least 25 ms from the criteria. Within 25 ms of the criteria either way, the result is INDETERMINATE. This 25 ms margin accounts for noise in the results. This is a conservative estimate; based on accuracy studies with similar numbers of data points, our noise level is probably significantly under that.
At release acceptance time, all results should be UNDER or at least INDETERMINATE. Results significantly OVER may not qualify for release acceptance.
Median launch time has been used for this determination, per current convention. p95 launch time might better capture a guaranteed level of quality for the user. In cases where this is significantly over the target, more investigation might be warranted.
Results
Calendar
2.0
- 180 data points
- Median: 1017 ms
- p95: 1311 ms
2.1
- 480 data points
- Median: 1214 ms
- p95: 1335 ms
Result: OVER (target 1150 ms)
Comment: Results are slightly slower than the last comparison, which was measured at 1182 ms.
Camera
2.0
- 240 data points
- Median: 1411 ms
- p95: 1802 ms
2.1
- 480 data points
- Median: 1558 ms
- p95: 1661 ms
Result: INDETERMINATE (target 1550 ms)
Comment: Results here are virtually the same as in the last run, and only very slightly (but not statistically significantly) over the newly revised target of 1550 ms.
Clock
2.0
- 390 data points
- Median: 901 ms
- p95: 1149 ms
2.1
- 480 data points
- Median: 1000 ms
- p95: 1101 ms
Result: INDETERMINATE (target 1000 ms)
Comment: 2.1 results are slightly slower than last run (972 ms). Results are right on the target.
Contacts
2.0
- 390 data points
- Median: 743 ms
- p95: 856 ms
2.1
- 480 data points
- Median: 866 ms
- p95: 934 ms
Result: UNDER (target 1000 ms)
Comment: Results are fundamentally unchanged from the last run.
Cost Control
2.0
- 360 data points
- Median: 1609 ms
- p95: 1839 ms
2.1
- 450 data points
- Median: 2611 ms
- p95: 2749 ms
Result: OVER (target 1000 ms)
Comment: This comparison shows Cost Control starting almost 130 ms slower on median than the last comparison (2482 ms).
Dialer
2.0
- 390 data points
- Median: 469 ms
- p95: 590 ms
2.1
- 480 data points
- Median: 550 ms
- p95: 604 ms
Result: UNDER (target 1000 ms)
Comment: Results are fundamentally the same as in the last comparison.
FM Radio
2.0
- 390 data points
- Median: 461 ms
- p95: 719 ms
2.1
- 480 data points
- Median: 508 ms
- p95: 697 ms
Result: UNDER (target 1000 ms)
Comment: Results are fundamentally the same as in the last comparison.
Gallery
2.0
- 390 data points
- Median: 873 ms
- p95: 1091 ms
2.1
- 480 data points
- Median: 961 ms
- p95: 1036 ms
Result: UNDER (target 1000 ms)
Comment: Results are fundamentally the same as in the last comparison.
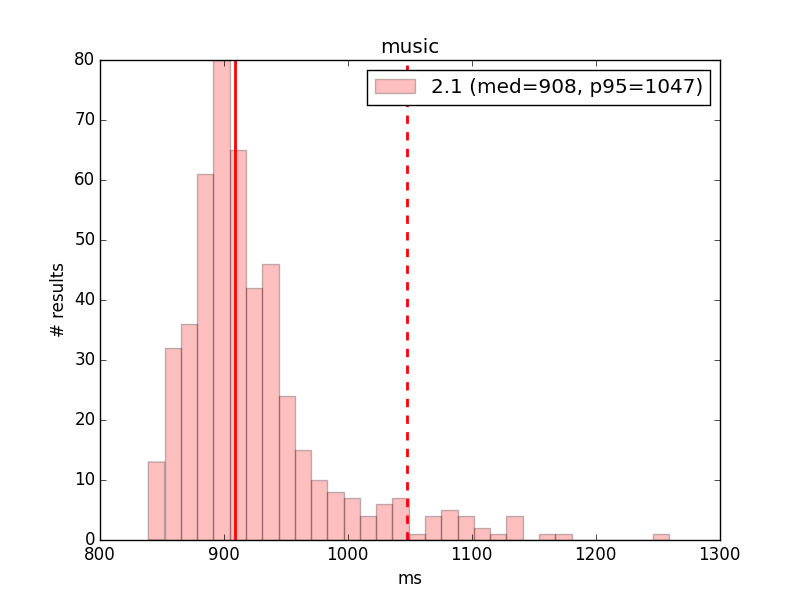
Music
2.1
- 480 data points
- Median: 908 ms
- p95: 1047 ms
Result: UNDER (target 1000 ms)
Comment: Music has slid another 26 ms since the last comparison (882 ms). This isn't terribly significant, but given that the last comparison was also a ~30 ms slide, it should be watched.
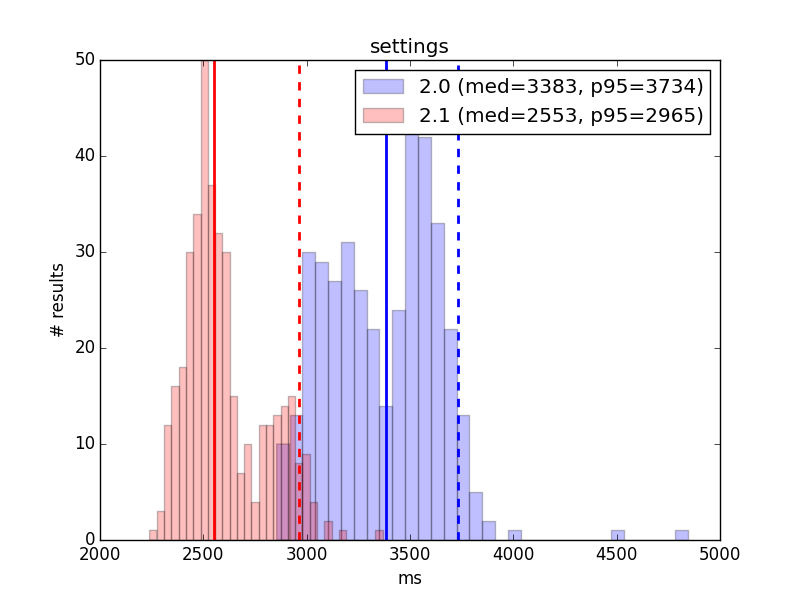
Settings
2.0
- 390 data points
- Median: 3383 ms
- p95: 3734 ms
2.1
- 480 data points
- Median: 2553 ms
- p95: 2965 ms
Result: UNDER (target 2600 ms)
Comment: Settings has once again improved significantly, beating its previous low point of 2577 ms. It is now under its newly-revised target.
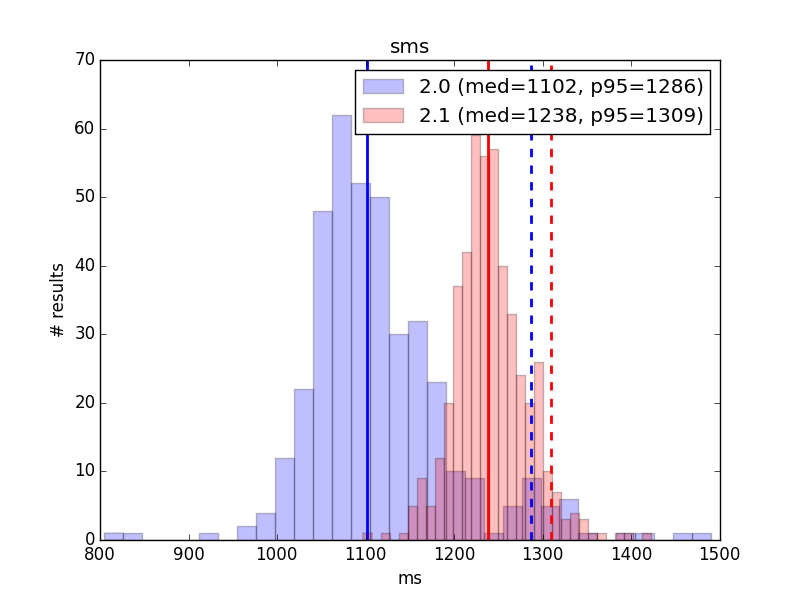
SMS
2.0
- 390 data points
- Median: 1102 ms
- p95: 1286 ms
2.1
- 480 data points
- Median: 1238 ms
- p95: 1309 ms
Result: OVER (target 1000 ms)
Comment: The 2.1 results for SMS are very similar to the last comparison, but a little slower. It has slipped 32 ms from 1206 ms measured previously.
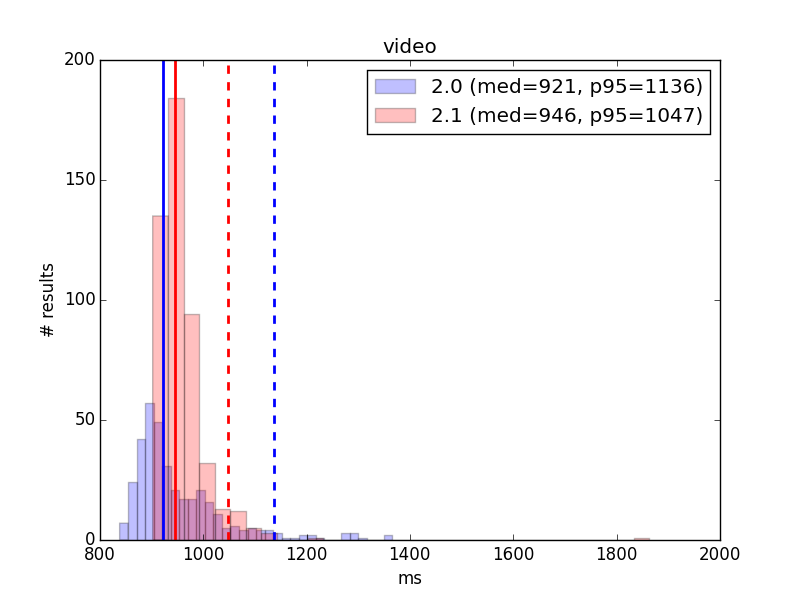
Video
2.0
- 360 data points
- Median: 921 ms
- p95: 1136 ms
2.1
- 480 data points
- Median: 946 ms
- p95: 1047 ms
Result: UNDER (target 1000 ms)
Comment: Results are fundamentally the same as in the last comparison.
Raw Data
TBA
