Drumbeat/Challenges/Visualize the Web
old version
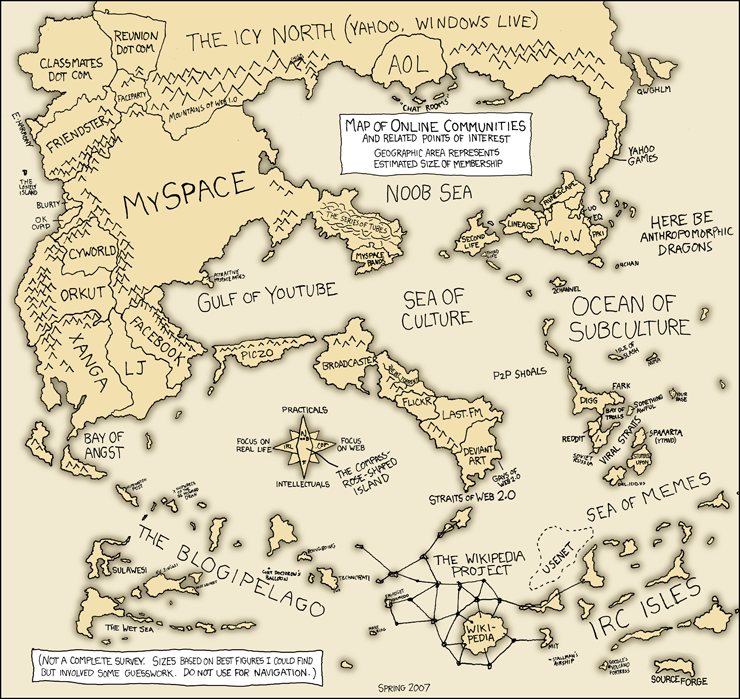
In a nutshell: Visualize the Web uses art, design and data to map the internet -- to help all of us understand the web, how it works and what it means.
At this stage, Visualize the Web is just an idea under the Mozilla Drumbeat umbrella. If you want to help, add your name and contact info below. We'll be in touch.
Objectives
- Transform the big, abstract internet into something simple and emotional that busy people can understand by ...
- Building a community of artists, designers and data nerds passionate about mapping the internet who ...
- Create tools and maps that help people understand how the internet works and where they fit in.
- Over time: use the insights from these maps to generate other kinds of tools and projects that add to users' experiences of the web.
The Idea
The web. Huge, and uncharted.
More than a billion people use the web – for business, for school, for friendship, to express themselves, to love. Despite the importance of the web in our lives, few of us understand how it works. It big, pervasive, complicated. And there are no good maps.
It's time to make some maps -- together.
Visualize the Web (needs better name) is about mapping the web -- using data and design to help us understand the internet and where we each fit in.
As a starting point: artists, designers, data nerds and everyday internet users are invited to propose ideas for visualizing the web. These could be literal and insightful. Or playful and thought provoking. The only constraint: use real (public and anonymous) data to tell a story about how it the internet works and what it means.
From there, we roll up our sleeves: working together to make the best design ideas real. Building maps that we can use and update over time to see the living internet, and to help make it better and more open.
Possible Activities
Building on the spirit of Mozilla Drumbeat, the idea is a) create opportunities for many people to participate in b) creating useful and lasting tools that help internet users understand the web. Possible steps along the way:
- Open ended design challenge where people sketch maps and data visualizations they'd like to see created.
- As a constraint, you probably want people to point to (or at least notionally explain) data sets that would make their visualization possible.
- Could be as simple as creative ways of communicating information already coming from places like Pew.
- Crowdsourced detective project to list and assess already publicly available data that would help us to better tell the story of the web.
- Simple example: data sources behind Internet World Stats
- Building out the 'low hanging fruit' maps based on the design challenge and easily available data sets.
- This is a combination of design and technical work. Idea would be to build a community to do all or most of it.
- Use this as a chance to demo interesting new open web tech -- eg. could do a bunch of this using processing.js if we could get the right developers.
- Also, identify a small set of maps and visualizations that can serve as an Internet Health (or Openness) Monitor. Invest in building these as something that can be maintained and used over time.
- Gap filling effort: identifying places where we don't know what the internet looks like, and finding ways to map this.
Lee: you've probably got a whole other set of ideas here. Please add.
Inspiration
Here are some examples of using data to visualize and explain the internet:
- Compilation of Web info graphics
- John Slater's dataviz bookmarks
- Akami web usage visualizations
- TwittEarth
What we want is more of this, plus a focus on generating specific insights (e.g. where is the web most open vs. most closed?).
People who are interested
- Lee Rainie, Pew Internet
- Mark Surman, Mozilla
- Karl Dubost
- Vijaya Ramanujam, National Institute of Design
- Diederik van Liere, Rotman School of Management
- Laura Miyakawa, Berkman Center
- [peterdf(at)elitemail.org
People to talk to
- Chris Messina (originally suggested something like this)
- Nathan Yau, the guy behind Flowing Data
- Lauren Cornell at Rhizome
- Clay Shirkey -- does he have students who might be interested in this project
- People at the Web Foundation
- Free Press?
- Berkman?
- CitizenLab at UofT?
- ...
Questions
- What's a good title for this? Something that captures both the data analysis and visual side of what we're doing.
- What guidelines do we need in place that we're genuinely using anonymous and public data? Who is a good person to lead this side of things?
- Who is already doing stuff like this? Is there anyone obvious to step up and take a lead? If so, we could back them.
- Are there Pew equivalents outside the US that we can reach out to and involve in this project?
- Mapping the Web means also locating. Finding the right balance between privacy (intimacy) and public is a big challenge. Which levels are we aiming to?
Timeline
It's too early to really say. We'll do a first call in December (below) and develop a basic roadmap by early January. We'll could do a simple design challenge on the Drumbeat site as early as February.
Get involved
If you'd like to get involved, add your name above or introduce yourself on the Mozilla Drumbeat mailing list.
Also, as a starting point, we'll be doing a brainstorming and planning call on December 21 at 3pm eastern time. This is a public call and anyone can join. The dial in info is here:
- Canada +1 416 848 3114 Ext. 92 Conference number 7601#
- US or Intl. +1 650 903 0800 Ext. 92 Conference number 7601#
- US Toll-Free +1 800 707 2533 Conference number 7601#
- Mozilla Drumbeat | IRC channel
Notes from Dec 21 call
Attendees:
- Janna Anderson, Imagining the Internet, Elon University (andersj@elon.edu) http://www.imaginingtheinternet.org
- Steve Bratt, World Wide Web Foundation (steve@webfoundation.org)
- Noshir Contractor, Northwestern University
- Lauren Cornell, Executive Director, Rhizome/ Adjunct Curator, New Museum (laurencornell@rhizome.org)
- David Eaves - Mozilla, Open Government Advocate - http://eaves.ca
- David Johnson, Center for Democracy and Technology - http://dotank.nyls.edu
- Colleen Macklin, Parsons
- Chris Messina - Free thinker - http://factoryjoe.com
- Michael Nelson, Visiting Professor, Internet Studies, Communication, Culture and Technology Program, Georgetown University (mnelson@pobox.com)
- Russ Neuman, University of Michigan (rneuman@umich.edu)
- Lee Rainie, Pew Internet Project, http://www.pewinternet.org (lrainie@pewinternet.org)
- Thomas Roessler, W3C (tlr@w3.org)
- Paul Russell
- Marc Smith, Connected Action Consulting, marc@connectedaction.net, http://www.connectedaction.net, NodeXL Team: http://www.codeplex.com/nodexl
- Mark Surman, Mozilla, http://wiki.mozilla.org/Drumbeat
Common Themes/High Level Goals:
- Use visualizations to tell a story
- Synthesize existing information
- Enabling everyone (your Grandmother) to understand the open internet and their role within it
- Enable people to create their own maps of the web, how they impact the web
- Engage a broad community, including artists, designers and data nerds
Other Possible Objectives:
- Work on HTML5 as way to express all this
- Break down the misunderstanding of "the web" as being device specific
- Show threats to the net in ways that help people get involved in stewarding the internet
- Show the web in a manner that helps people can talk about more concretely
- Show the fragility of the network
- Synthesize what's already there in internet maps, and publish a book that deals with this
- Crowd-source visualization: get people to share how they use the internet and then map
- how we form persistent groups online
- how we are spending our attention online
- Internet archives as a dataset for visualization - example where stuff is stored – continuous scraper -- not for profit to document the web
Things that might visualized:
- Cloud computing
- DNS
- Data centers
- Blockages and throttling
- Show who is creating content (professional vs. user generated)
- Show "the myths of the internet", help explain core infrastructure like the domain name system
- A web index - ways the web has empowered people around the world
- Infrastructure or connectivity or applications
- Degree of wall "gardenedness" caused by applications or languages
- Map/measure policy regimes
- Get people to report on their "affiliation" and how they are using the internet (e.g. how do people form persistent groups online) in order to map them
- Visualize twitter, youtube, flickr, email, facebook, www networks
- Show individuals what they are doing with their time online, your attention vs. world's attention
- Map how local/national policy regimes affect internet use
- Map what kinds of social impacts manifest through web and what policy implications emerge from the way the web is designed -- includes link data
- Security and Privacy - Use and abuse of firewalls, content filters and VPNs
Examples:
See "How the Internet Works" for examples of good graphics about infrastructure of the Net: http://www.amazon.com/How-Internet-Works-Preston-Gralla/dp/0789729733 4 dimensional visualizations: Example of Ebay map of Black Friday purchases and the New York Times displaying traffic sources over a 24 hr period Possible examples include work done on H1N1 or environmental degradation
Other thoughts/questions:
- Who would be the audience?
- Pew = policy makers, journalists, engaged citizens
- Mozilla (the same but reverse order)
- Tie into occasions like one web day where people self report
- People have a lack of ownership over the web, they take it for granted
- could we use these visualizations to help people feel they are a part of this network
- which hopefully gets them to feel like they should help protect it
- give the design challenge: create ways that people see and feel themselves in the network?
- "The influence you've had as a citizen of the web."
- Pay attention to gaming as part of the web -- gaming different from other web activities
- Dataplay -- visualization to the next level -- playful experiences with data
Existing projects/Possible Partners/Possible Drumbeaters:
- International Network for Social Network Analysis
- Web Science Trust -- community and labs soon to be a dozen strong
- Aaron Koblin of Google is on the edge with creativity in incorporating all possibilities in data sharing. Good video with him here: http://creativity-online.com/work/cat-2009-the-wizard-of-data-art-aaron-koblin/16690
- Heather Chaplin's recent whitepaper: National Public Lightpath: Documentation and Recommendations seeks to map some future directions for how the internet might serve the public good. http://www.publiclightpath.org/sites/default/files/NPL_WhitePaper_Ford.pdf
- Free and open: NodeXL: Network Overview Discovery and Exploration add-in for Excel 2007 - http://www.codeplex.com/nodexl
Foundation for Social Media Research, may become a useful partnership with Mozilla. Goals: Open tools, data, scholarship related to social media and computer-mediated collective action
- Possible Tools:
- Network canvas, metrics calculation, visualization layouts
- ThreadMill: collect and analyze threaded message collections
- BlogMill:
- WikiMill:
Data archive: collections of data relevant to the study of the internet
Rob Ackland is using NodeXL to map the web (he’s basing VOSON on Firefox, http://voson.anu.edu.au/).
Mapping Iran's Online Public http://cyber.law.harvard.edu/publications/2008/Mapping_Irans_Online_Public
Many Eyes: IBM Research http://manyeyes.alphaworks.ibm.com/manyeyes/
Visual Complexity http://www.visualcomplexity.com/vc/
Flowing Data http://flowingdata.com/
Martin Dodge’s Atlas of Cyberspace which was a book and website (1997-2004), with hundreds of variations: http://personalpages.manchester.ac.uk/staff/m.dodge/cybergeography/atlas/atlas.html
Katy Borner’s heroic ten-year effort (now in its 6th year) on Science Maps http://scimaps.org/ has produced exhibits worldwide and a book, with many relevant examples.
Commercial tools based on our work such as www.spotfire.com and treemaps, such as http://www.hivegroup.com have been used to visualize pieces (e.g. Diggs) or usage patterns.
Content prepared by industry analysts/consultants such as Gartner - http://www.gartner.com/it/page.jsp?id=1124212 and Wakoopa (“Throughout the Dayâ€ン graphics) http://www.scribd.com/doc/19137261/WakoopaThe-State-of-Apps-Q2
Workshops on Technology-Mediated Social/Civic Participation www.tmsp.umd.edu . The first was at PARC last week
DATAPLAY: Mapping Game Mechanics to Traditional Data Visualization http://www.digra.org/dl/db/09287.11403.pdf
Data sources of interest to visualize: Web logs Twitter logs Data.gov http://data-gov.tw.rpi.edu/wiki/Demos Google Fusion
- CAIDA: http://www.caida.org/home/
- Understanding USA - book that examines statistics of the United States, creating a map of US based on data. Great example of bringing the internet to life for a broader audience. (http://www.amazon.com/Understanding-USA-Richard-Saul-Wurman/dp/0967453607/ref=sr_1_1?ie=UTF8&s=books&qid=1261426690&sr=8-1)
Sample map: World Map of Social Networks: http://www.techcrunch.com/2009/12/21/world-map-social-networks/
Internet Society look at architecture of the "Internet Ecosystem" - Internet governance - http://www.isoc.org/pubpolpillar/docs/internetmodel.pdf
Hans Rosling - done great work with visualizations (including at TED) http://www.roslingsblogger.blogspot.com/ http://en.wikipedia.org/wiki/Hans_Rosling
- Proposed Title for David Johnson's book/map: Not Surfing Alone??
- The Future of Making illustration by the Institute for the Future - http://www.boingboing.net/2008/05/05/future-of-making-map.html
- The Extinction Timeline and other graphics by the Future Exploration Network - http://futureexploration.net/
- The Internet Memes Timeline - http://www.dipity.com/tatercakes/Internet_Memes
- Information is Beautiful – http://www.informationisbeautiful.net/ (Hierarchy of Digital Distractions - http://www.informationisbeautiful.net/visualizations/the-hierarchy-of-digital-distractions/; Who Rules the Social Web? http://www.informationisbeautiful.net/2009/who-rules-the-social-web/ )
- Graphjam - generally for fun, but there’s important social and cultural commentary here
- Vincenzo Cosenza's World Map of Social Networks - http://www.vincos.it/world-map-of-social-networks/
- Web Science Trust : http://webscience.org/home.html
The Web is the largest human information construct in history. The Web is transforming society. In order to understand what the Web is, engineer its future and ensure its social benefit we need a new interdisciplinary field that we call Web Science.
- Trustlet, trust metrics research project, also has an overview of visualizations