RemoteDebugging: Difference between revisions
(Describe nested debugger invocation.) |
(Explain nested debugging. Remove discussion of same-stack debugging and its limitations.) |
||
| Line 36: | Line 36: | ||
evaluateInFrame facility: | evaluateInFrame facility: | ||
[[File: | [[File:Expression-evaluation.png]] | ||
If evaluation of the expression throws an exception or hits a breakpoint, | If evaluation of the expression throws an exception or hits a breakpoint, | ||
| Line 45: | Line 45: | ||
resulting in a nested debug server invocation: | resulting in a nested debug server invocation: | ||
[[File: | [[File:Expression-nested-exception.png]] | ||
If the debugger elects to debug a worker thread, the main thread acts as a | If the debugger elects to debug a worker thread, the main thread acts as a | ||
| Line 62: | Line 62: | ||
[[File:content-process.png]] | [[File:content-process.png]] | ||
Revision as of 22:44, 19 May 2010
Remote Debugging
Mozilla will support remote debugging with a two-level protocol, roughly modeled after the Debugger Protocol and the Chrome Developer Tools Protocol.
The remote protocol operates at the JavaScript level, not at the C++ or machine level. It assumes that the JavaScript implementation itself is healthy and responsive: the JavaScript program being executed may have gone wrong, but the JavaScript implementation's internal state must not be corrupt. Bugs in the implementation may cause the debugger to fail; bugs in the interpreted program must not.
Debugging States
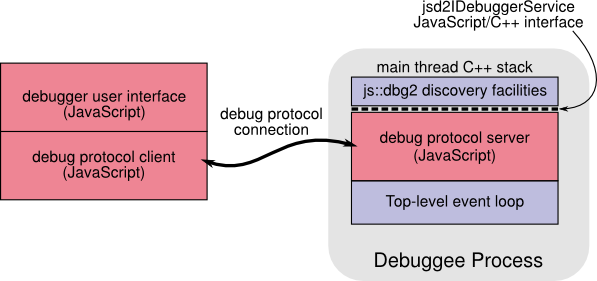
When a debugger client first makes a connection to a Mozilla process, no debugging sphere has yet been selected, and the server uses the js::dbg2 sphere discovery facilities to answer client requests about what is available to be debugged in that process:
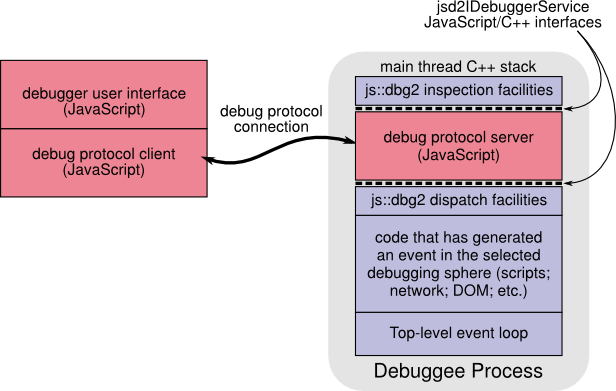
Selecting a debugging sphere establishes event handlers which invoke the debug server to communicate the news to the debugger. Assuming the selected sphere runs on the main thread, the stack looks like this while the event is being reported:
When the debugger asks the debuggee to continue, the frames for the js::dbg2 dispatch facilities simply return, and the code that generated the event resumes execution.
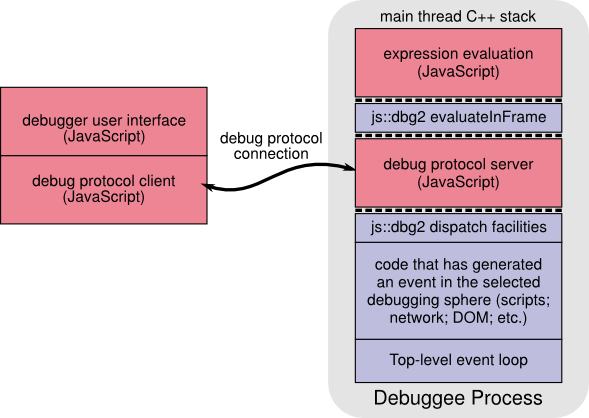
If the user asks the debugger to evaluate an expression that requires evaluating JavaScript code (like e.x()), then that evaluation takes place without leaving the dynamic scope of the trap handlers, but in the static scope in which the event was generated, using js::dbg2's evaluateInFrame facility:
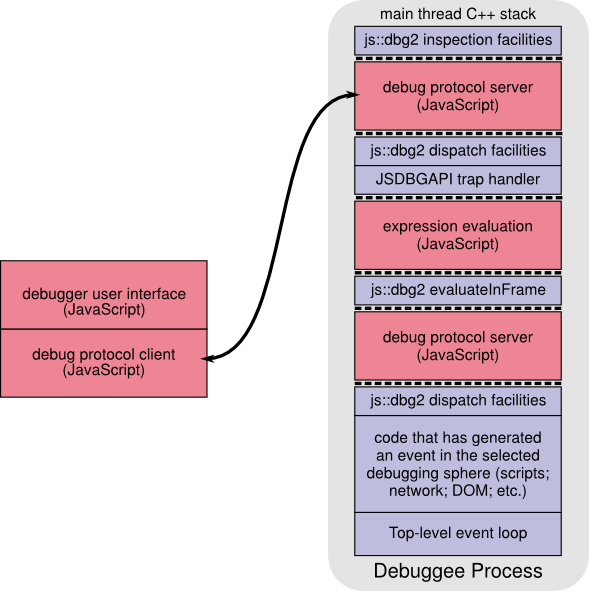
If evaluation of the expression throws an exception or hits a breakpoint, then the result is a matter of user interface. Either we abandon evaluation of the expression, and control returns to the original debug protocol server frames, or we treat the event as something to be investigated, just as if it had occurred in the debuggee's normal course of execution, resulting in a nested debug server invocation:
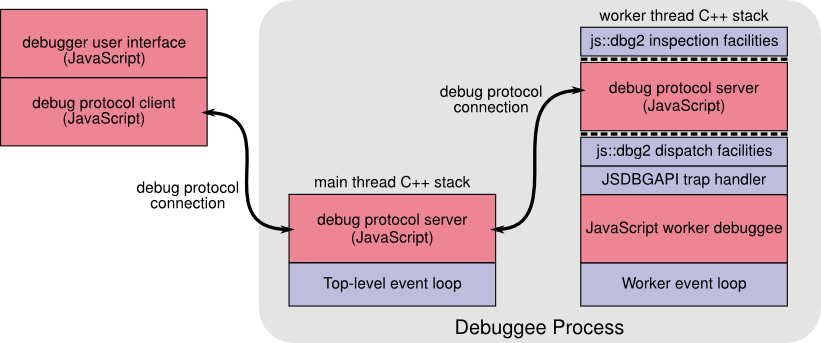
If the debugger elects to debug a worker thread, the main thread acts as a proxy, relaying messages to the worker thread's server:
(I am not sure whether we want to keep things this way, or have the debugger connect directly to its debuggees. Being able to debug many threads with a single socket connection seems like a win, and we still get the inter-thread synchronization benefits; but latency might affect the debuggers' users' experience. Let's code it and see!)
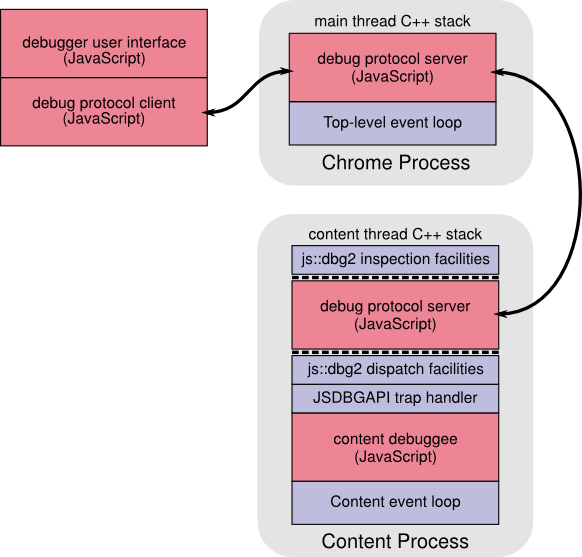
If Mozilla puts content and chrome in separate processes, then the remote protocol can be readily used to continue to support content debugging:
