B2G/Debugging OpenGL: Difference between revisions
| Line 45: | Line 45: | ||
===Run b2g=== | ===Run b2g=== | ||
I used the following run-apitrace.sh script, which places the trace in /data/egl.trace. If you don't specify <tt>TRACE_FILE</tt> then it | I used the following run-apitrace.sh script, which places the trace in /data/egl.trace. If you don't specify <tt>TRACE_FILE</tt> then it will be called <tt>firefox.trace</tt> and will be placed in the same directory as the executable, so <tt>/system/b2g/firefox.trace</tt> | ||
<pre> | <pre> | ||
#!/bin/bash | #!/bin/bash | ||
Revision as of 20:01, 31 October 2012
This page describes how to use the apitrace tool to debug OpenGL calls when using Boot2Gecko.
Special thanks goes out to gw280 who wrote the following: http://www.hackermusings.com/2012/03/debugging-opengl-on-android-without-losing-your-sanity/ which is what most of this is based on.
Get a copy of apitrace
The first thing to do is to grab a copy of apitrace.
git clone https://github.com/apitrace/apitrace.git
The INSTALL.markdown file contains instructions for building. I'll summarize what I did (I was running Linux Mint 13 at the time).
Install the Android NDK
cd /home/work
wget http://dl.google.com/android/ndk/android-ndk-r8-linux-x86.tar.bz2
tar xf android-ndk-r8-linux-x86.tar.bz2
Install cmake and needed Qt packages
sudo apt-get install cmake libqjson-dev libqtwebkit-dev
Build for the host (linux)
cmake -H. -Bbuild
make -C build
Build for the phone
export ANDROID_NDK=/home/work/android-ndk-r8
cmake -DCMAKE_TOOLCHAIN_FILE=cmake/toolchain/android.toolchain.cmake -DANDROID_API_LEVEL=9 -H. -Bbuild-b2g
make -C build-b2g
The egltrace.so for the ARM will be found in libs/armeabi-v7a/egltrace.so
Install egltrace.so onto the phone
adb push build-b2g/wrappers/egltrace.so /data
Run b2g
I used the following run-apitrace.sh script, which places the trace in /data/egl.trace. If you don't specify TRACE_FILE then it will be called firefox.trace and will be placed in the same directory as the executable, so /system/b2g/firefox.trace
#!/bin/bash
#set -x

. load-config.sh

ADB=adb
B2G_BIN=/system/b2g/b2g

B2G_PID=`$ADB shell toolbox ps |
         grep "b2g" | awk '{ print \$2; }'`

$ADB shell kill $B2G_PID
$ADB shell stop b2g
$ADB shell TRACE_FILE=/data/egl.trace LD_PRELOAD=/data/egltrace.so LD_LIBRARY_PATH=/system/b2g ${B2G_BIN}
Analyze the captured trace
export EGL_SOFTWARE=true
qapitrace
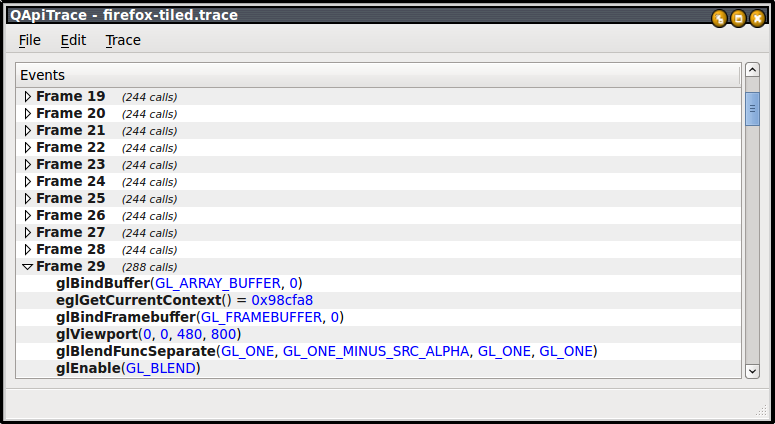
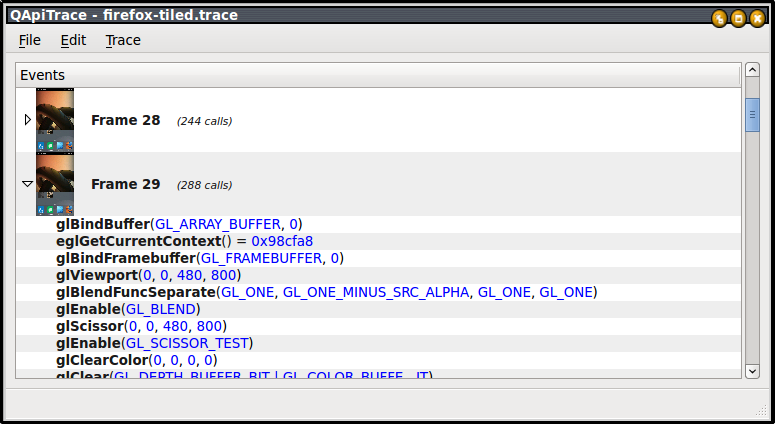
If you choose Trace->Replay then you should see the capture replay the captured trace, and it will then show a thumbnail next to each frame.
Before running Trace->Replay
After running Trace->Replay
Troubleshooting Replay
If the Trace-Replay doesn't work, then you may be missing some libraries. Try to run:
eglretrace egl.trace
I found that libEGL.so.1 was missing and was able to install it using
sudo apt-get install mesa-utils-extra

