Labs/Memory Profiler: Difference between revisions
< Labs
Jump to navigation
Jump to search
(added more docs) |
(→Building from Source: updated) |
||
| Line 13: | Line 13: | ||
You can access the tool by going to the "Tools" menu and selecting "Memory Profiler". | You can access the tool by going to the "Tools" menu and selecting "Memory Profiler". | ||
= | = Getting The Source = | ||
Just clone the HG repository: | |||
http://hg.mozilla.org/ | http://hg.mozilla.org/users/avarma_mozilla.com/memory-profiler/ | ||
And then read the [http://hg.mozilla.org/users/avarma_mozilla.com/memory-profiler/file/tip/README.txt README]. | |||
= Understanding the Source = | = Understanding the Source = | ||
Revision as of 03:03, 7 October 2009
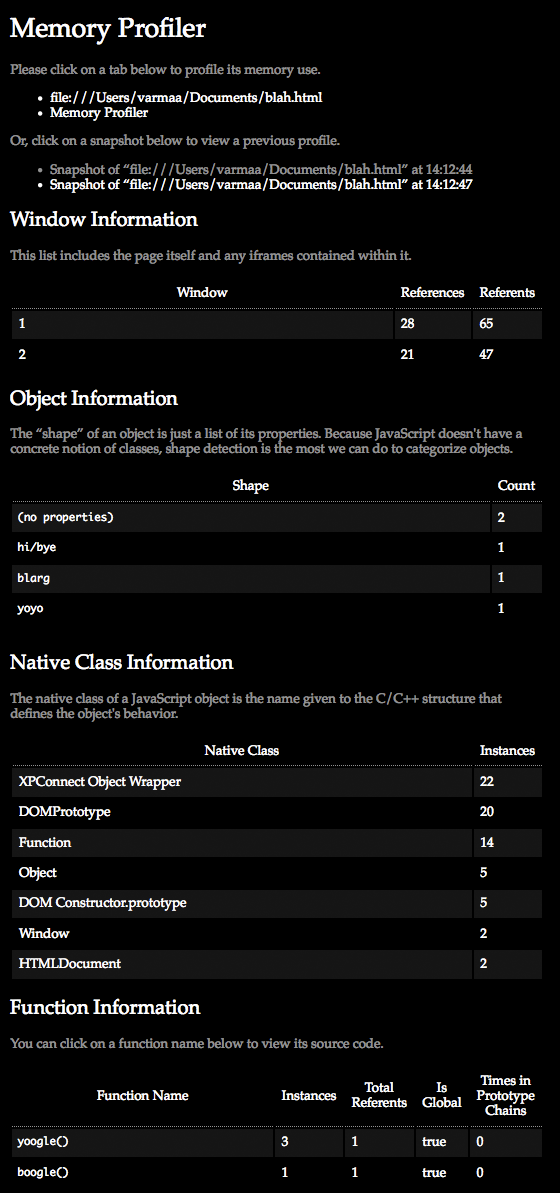
Memory Profiler is an experimental Labs project that attempts to make debugging memory use in web pages easier.
For more information about the tool's design and rationale, see Atul's blog post entitled Web Application Memory Profiling, Take Two.
Installation and Use
The Firefox extension is available here:
https://addons.mozilla.org/en-US/firefox/addon/14666/
You can access the tool by going to the "Tools" menu and selecting "Memory Profiler".
Getting The Source
Just clone the HG repository:
http://hg.mozilla.org/users/avarma_mozilla.com/memory-profiler/
And then read the README.
Understanding the Source
For information on how to create your own custom memory profiling routines, check out the Jetpack Binary Components API.
See Atul's blog post entitled Fun with SpiderMonkey for information on how the memory profiler works.