RemoteDebugging
Remote Debugging
Mozilla will support remote debugging with a two-level protocol, roughly modeled after the Debugger Protocol and the Chrome Developer Tools Protocol.
The remote protocol operates at the JavaScript level, not at the C++ or machine level. It assumes that the JavaScript implementation itself is healthy and responsive: the JavaScript program being executed may have gone wrong, but the JavaScript implementation's internal state must not be corrupt. Bugs in the implementation may cause the debugger to fail; bugs in the interpreted program must not.
Debugging States
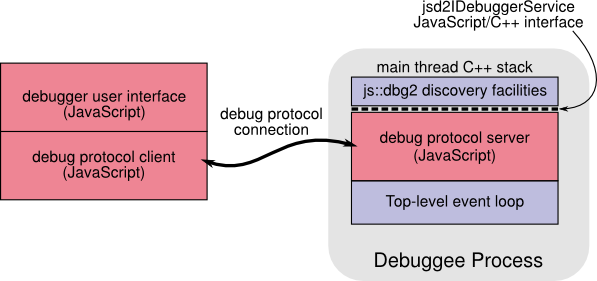
When a debugger client first makes a connection to a Mozilla process, no debugging sphere has yet been selected, and the server uses the js::dbg2 sphere discovery facilities to answer client requests about what is available to be debugged in that process:
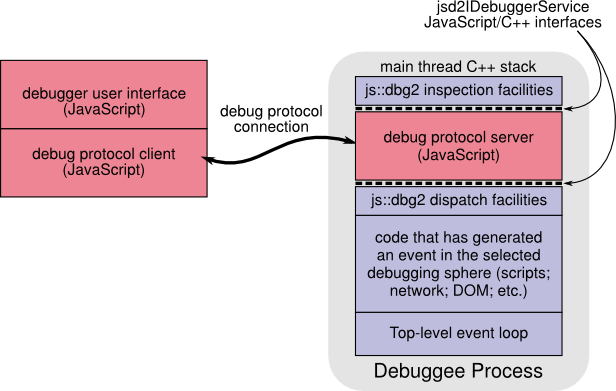
Selecting a debugging sphere establishes event handlers which invoke the debug server to communicate the news to the debugger. Assuming the selected sphere runs on the main thread, the stack looks like this while the event is being reported:
When the debugger asks the debuggee to continue, the frames for the js::dbg2 dispatch facilities simply return, and the code that generated the event resumes execution.
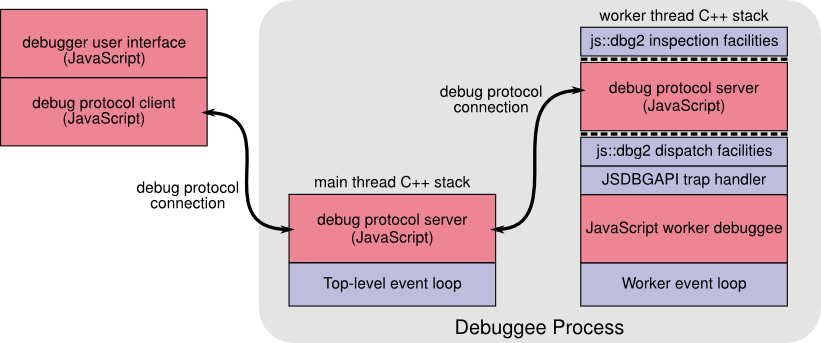
If the debugger elects to debug a worker thread, the main thread acts as a proxy, relaying messages to the worker thread's server:
(I am not sure whether we want to keep things this way, or have the debugger connect directly to its debuggees. Being able to debug many threads with a single socket connection seems like a win, and we still get the inter-thread synchronization benefits; but latency might affect the debuggers' users' experience. Let's code it and see!)
Evaluating User Expressions
If the user asks the debugger to evaluate an expression that requires evaluating JavaScript code (like e.x()), then the C++ stack looks like this:
| interpreter/JITted frames for expression given to debugger |
| debugger machinery frames |
| interpreter/JITted frames for debuggee |
| top-level event loop |
If evaluation of the expression throws an exception or hits a breakpoint, then the result is a matter of user interface. Either we abandon evaluation of the expression, and C++ control returns to the original machinery frames:
| debugger machinery frames |
| interpreter/JITted frames for debuggee |
| top-level event loop |
Or we treat the event as something to be investigated, just as if it had occurred in the debuggee's normal course of execution:
| nested debugger machinery frames |
| interpreter/JITted frames for expression given to debugger |
| debugger machinery frames |
| interpreter/JITted frames for debuggee |
| top-level event loop |
Again, the debugger machinery is not written to tolerate corrupt interpreter data structures or incomplete execution states; it relies on the interpreter's debugging API working correctly.
Same-Stack Debugging
In the current model for debugging Firefox, the debugger runs in the same process as the debuggee. Since the XUL user interface only allows one thread to interact with it, the debugger's user interface must share a thread, and thus a stack, with the debuggee. Thus, when the debuggee is paused and the user is interacting with the debugger's user interface, the C++ stack looks like this:
| debugger UI frames (that is, more interpreted/JITted JS frames) |
| nested event loop invocation |
| debugger machinery frames |
| interpreter/JITted frames for debuggee |
| top-level event loop |
There are a number of complications that arise from this model:
- The debugger's UI and the debuggee share a DOM, and may interact with each other in unexpected ways through that DOM.
- The debugger should never refer to the debuggee's objects directly --- it is too easy to introduce bugs and security holes by doing so. However, avoiding this is similar to the problem of ensuring that references between Firefox chrome and content go through the proper wrapper objects. This seems to be challenging in practice.
Remote Debugging
One way to avoid the issues mentioned above is to move the debugger UI into its own process, and have it communicate with the debuggee using a wire protocol. (See Remote Debugging, above.)
This ability is also helpful when the debuggee is running on a device with a limited user interface (say, a mobile phone or tablet computer): it can be valuable to have the debugger's user interface running on a workstation or laptop. In this case, the C++ call stack looks like this:
| debug protocol server |
| nested event loop invocation |
| debugger machinery frames |
| interpreter/JITted frames for debuggee |
| top-level event loop |
The stack of the debugger's user interface can be whatever is convenient, as long as it communicates appropriately with the debug server. But one possible arrangement would be to treat the protocol as simply another back end for the js::dbg2 interface; the debugger UI would behave identically regardless of whether the debuggee was local or remote. Thus, the C++ stack in the process running the debugger UI would look like this:
| debugger UI frames |
| nested event loop invocation |
| debugger machinery frames |
| debugger back end: debug protocol client |
| top-level event loop |
Remote debugging also enables debugging worker threads: if the worker's top-level event loop responds to messages registering the debugger's interest in the sphere
Remote debugging also prepares us to support debugging content in an architecture which places content JavaScript in separate processes from chrome JavaScript.
Separate Windows Cannot Be Debugged Independently
One interesting consequence of the fact that Firefox uses a single thread for all chrome and content JavaScript is that independent windows (in the sense of an HTML5 "Window" object; tabs are windows) cannot be debugged independently. Suppose we hit a breakpoint in one window:
| debugger UI frames |
| nested event loop invocation |
| debugger machinery frames |
| interpreter/JITted frames for first window |
| top-level event loop |
Then we switch to a different window and hit a breakpoint there, as well:
| debugger UI frames |
| nested event loop invocation |
| debugger machinery frames |
| interpreter/JITted frames for second window |
| nested event loop invocation |
| debugger machinery frames |
| interpreter/JITted frames for first window |
| top-level event loop |
(I believe Firebug currently forbids this situation from arising, either by refusing to allow debugging to occur in the second window, or by throwing away the first window's JavaScript stack. But the goal here is to point out intrinsic limitations in Firefox's execution model, regardless of how Firebug behaves.)
In this case, we cannot simply switch back to the first window and resume execution there: we must first finish (or abandon) execution in the second window, because its stack frames are on top of the ones we wish to resume.
There are two general solutions. The first would be to change SpiderMonkey to represent the JavaScript stack entirely in the heap, such that no C++ frames accumulate in the above scenario, and then use a separate JavaScript stack for each window. However, aside from the engineering work needed, accomodating native frames mixed with JavaScript frames in this arrangement would be a challenge.
The second is to change Firefox to use a separate C++ stack for each window, by creating a separate thread for each window. These threads would not run concurrently (if properly designed, the functions for passing control from one stack to another can guarantee this), avoiding the sorts of unreproducible behavior that make most multi-threaded, shared memory programming so difficult.
If Firefox evolves towards a process-per-window model, then it will have a separate stack per window, and the debugging restrictions described above can be lifted. However, if the user creates a large number of windows, Firefox may need to have windows share processes; in this case, the multiple, non-mutually-preemptive thread model described above could provide consistency between the process-per-window and several-windows-per-process arrangements.


