Perfomatic
Jump to navigation
Jump to search
Summary
The Mozilla graph server is used to understand how multiple performance metrics change over time. It is a web application for creating graphs of performance test results for a user-configurable combination of branch, operating system and machine.
People
- Rob Helmer (rhelmer), Alice Nodelman (anode), Laura Thomson (laura), Chris Howse (chowse)
- IRC: #perfomatic
Bugs
Requirements
Architecture
Overview:
- Talos creates build
- Talos runs a test
- Sends data from test to:
- bulk.cgi - for multiple data points
- collect.cgi - for 1 data point
- bulk.cgi or collect.cgi input into mysql db
- graphs.mozilla.org/graphs.html
- displays a line graph of the data over time
- Single point on graph is an average(ish) of the tests on that day
Diagrams, etc
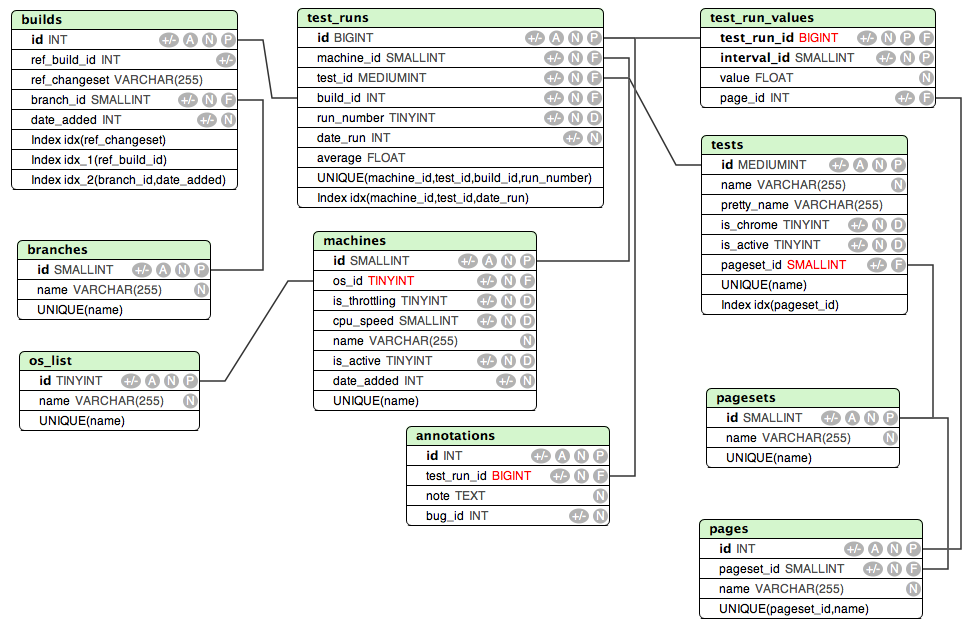
- Schema notes
- DB schema diagram
- Architecture notes
- Morgamic's architecture diagram
- How data is sent to the graph server