Firefox OS/Performance/Automation/Tools/Regression Detection Requirements
Contents
Automated Performance Regression Detection
Parameters
As of 19 June, 2014, the current rate of changesets in Gaia is around 2-3 per hour and the rate of revisions to Gecko is around 12-15 per hour. Given those numbers, we would need 45-50 flame devices (3 * 15 + 5 = 50) dedicated to only regression detection to test every commit. And even with that, we would be limited to test runs that take less than an hour to flash, and test.
There is a smarter way to accomplish this task with much fewer devices. Mason's BackoutBot has demonstrated that with 4-5 Flame devices, we can test every Gaia changeset. The real difficulty comes when trying to test every Gecko, so the strategy is to avoid that altogether.
If the automated testing framework monitors the Gecko repo and updates Gecko every time 16 revisions or 1 hour goes by--whichever is sooner--then we only have to add an aditional 3 devices to the pool to be able to keep up with Gecko. Whenever we detect a regression in Gecko, we will task three of the Flame devices to do a bisection of the revisions since the last Gecko update. By limiting the number of revisions 16, we can be certain that the bisection will take no more than 4 test runs (i.e. log2 16 = 4). If we use three devices, we can test 2 steps at a time. One device tests the current middle while the other two test the middles for the next stage. Once we know if the current middle is good or bad, we know which of the next stage middles to look at. If we repeat once more, we'll have bisected all 16 in 2 test passes.
Requirements
- 8-10 Flame devices.
- Flashable builds for every Gecko commit.
- Automated runs of make test-perf
- Automated regression detection tool
Regression Detection Strategy
The strategy for finding discreet shifts in the mean values of test results, despite the noise, is based on using step detection algorithms. Probably the simplest approach would be to use k-means clustering to detect discreet groupings, or "modes", of the means of the test runs.
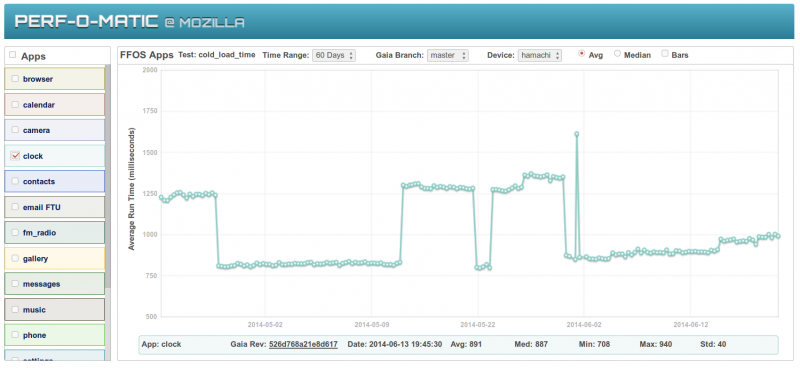
To visualize what the k-means clustering would get us, let's examine recent data from the Clock app on datazilla. The data points are the mean value for cold launch time measured by b2gperf over 30 runs. The datazilla plot looks like this:
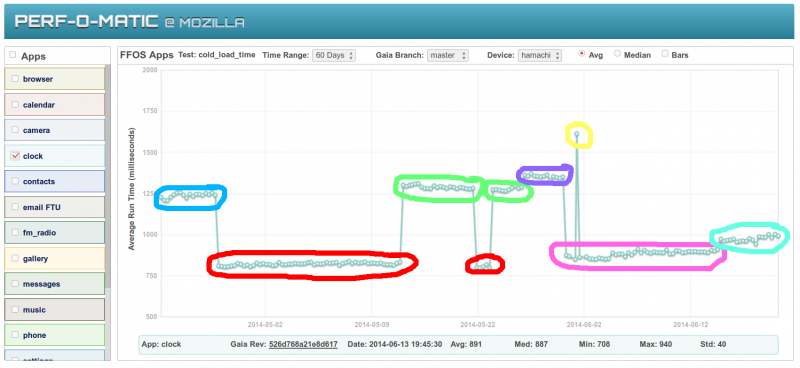
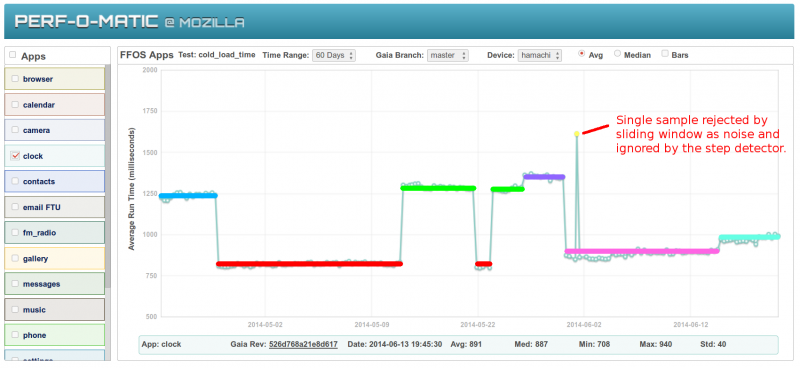
Running the data through a k-means clustering algorithm, the data points get clustered together into groups as illustrated in the image below. Each color represents a distinct cluster. The clustering algorithms have a few tunable parameters for deciding if a data point "fits" in an existing cluster or should become it's own cluster. This acts as like a wideband, low aplitude filter and greatly reduces false positives caused by entropy rather than legitimate regressions. once the clustering happens, all data samples in a given cluster are set to the mean value of the cluster. The bottom image shows the flat lines representing all data points in each cluster having the same value.
After clustering, the regression detection algorithm uses a sliding widow of a fixed number of data points. The width of the window is tunable. Using a sliding window acts as a low pass filter and the width of the window sets the cutoff frequency. To put it in plain terms, if the sliding window is 4 samples wide, any 2 adjacent data points that fall into their own cluster and are bookended by data points in another cluster will get ignored. In the picture below, the yellow cluster is only a single data point that is bookended by data points in the purple cluster. A sliding window equal to or greater than 3 would reject the yellow cluster from the step detection as outlier noise.
After the sliding window filters out the high frequency, the step detection pass walks along in time order and examines what happened each time there is a transition from one cluster to the next. If there is a "positive" transition (e.g. cluster_mean1 - cluster_mean2 > 0) it will interpret that as an increase in the test results mean and flag it as a regression--assuming lower numbers are better. It is also able to detect "negative" transitions where the test results mean shifts downward and actually gets better.


