User:Paul/DevToolsMockup
With these mockups, I'm trying to give a global overview of what the Firefox DevTools could look like. These mockups try to follow these requirements:
- The tools must be easily reachable
- The tools must not invade the content but we must avoid new windows
- The tools UI must be customizable
We can split the tools in 2 categories:
- Page centric tools
- Node centric tools
Global Toolbar
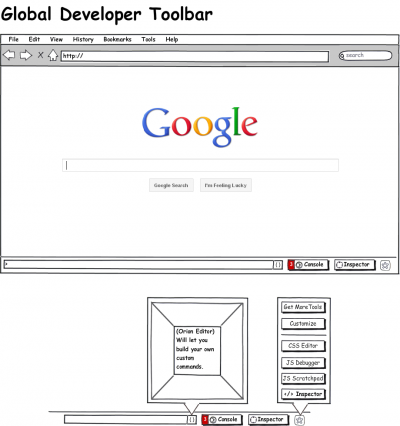
We are experimenting with a Global Developer Toolbar, that would be located at the bottom of the browser.
- All the page centric tools should be accessible from this toolbar.
- The toolbar is customizable like other Firefox toolbars
- The toolbar will include a Global Command Line (gcli)
- control tools
- custom commands (see the '{}' button)
- works with the Web Console
- The Web Console is, by default, accessible from the toolbar
- The Inspector is, by default, accessible from the toolbar
- Other tools are accessible via a menu
Page Centric Tools
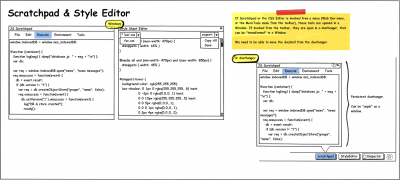
Page centric tools like Scratchpad or the Style Editor are accessible from the Global Toolbar. These tools can be opened in:
- a doorhanger
- a window
If the tool is opened from toolbar, then the tool is opened in a doorhanger.
If the tool is opened from a menu (main Firefox menu or the Toolbar menu), then the tool is opened in a window.
From the doorhanger, the tool can be detached (moved to a window).
The WebConsole
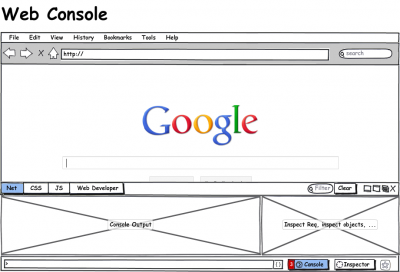
Even though the WebConsole is a Page Centric tool, the console is open above the toolbar as an extension of the gcli.
The WebConsole is split it two:
- console output
- secondary content (HTTP Request panel, Object inspector, ...). The console should not open any window.
Scratchpad and Style Editor
Node Centric Tools
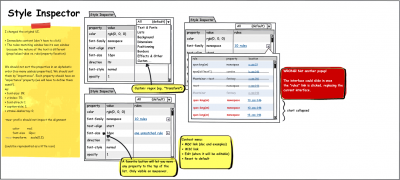
Some tools make sense only if a node is selected (the Style Inspector for example).
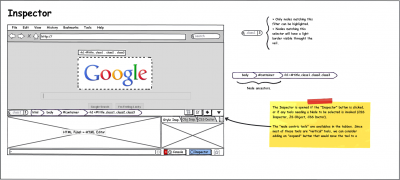
If such a tool is invoked, or if the Inspector button is pressed, then 3 things happen:
- the highlighter is activated
- the Inspector toolbar appears on top of the global toolbar.
- (optional, but true by default) a HTML Panel appears between the Inspector toolbar and the Global Toolbar.
This will let the user select a node.
The highlighter
The highlighter is the mechanism that will let you select a node from the page itself (click on the node).
The HTML Panel
The HTML Panel is split in 2. The left zone will let you select the node in the HTML Tree. The right one will embed the Node Centric tools, à la Firebug (with tabs).
The panel can be collapsed from the Inspector Toolbar.
The Inspector toolbar
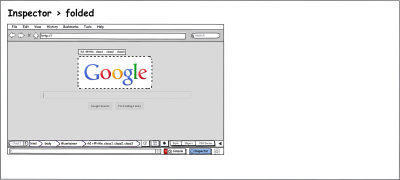
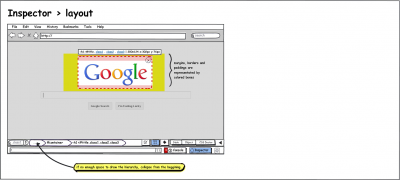
The Inspector toolbar is supposed to be able to replace the HTML Panel for most of the use cases and then avoid covering an important part of the web page.
The highlighter should be enough to select a node. But if the user wants to be able to narrow his selection, a "Hierarchy" ribbon will let the user browse the parent nodes of a preselected node.
Also, a searchfield will let the user write its own selector.
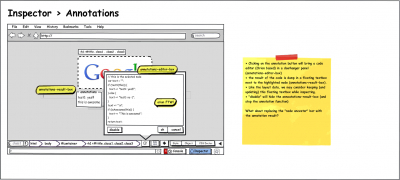
The Node Centric tools, available as buttons in this toolbar, will be opened in a doorhanger (and again, the tool should be detachable).
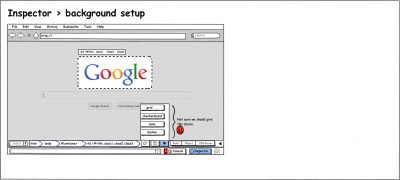
Other "Inspection Tools" are available from this toolbar:
