MozillaQualityAssurance:Graph Server: Difference between revisions
Jump to navigation
Jump to search
No edit summary |
|||
| Line 7: | Line 7: | ||
== Pretty Pictures == | == Pretty Pictures == | ||
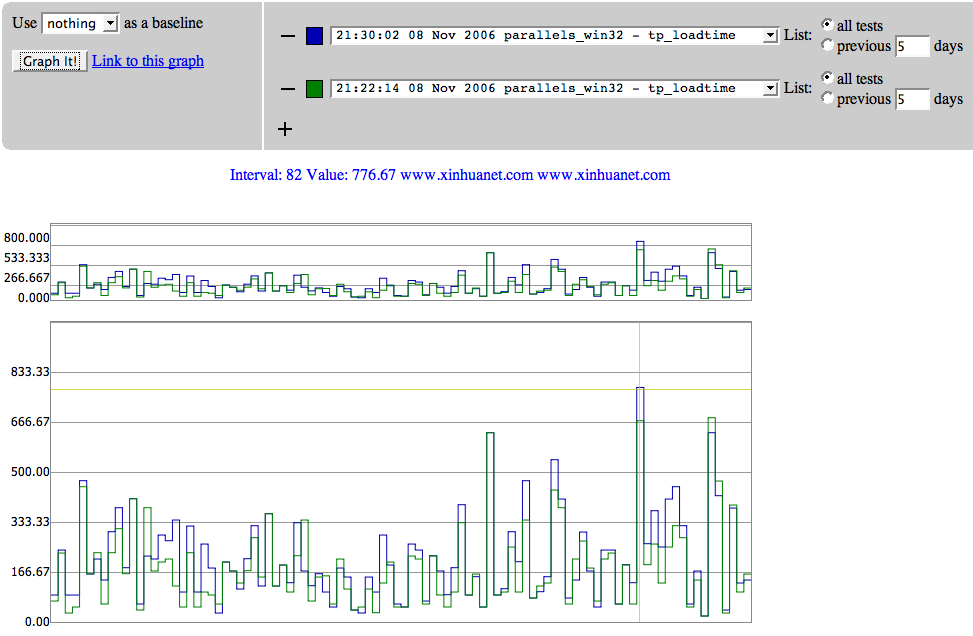
This example shows an overlay of two data sets generated by two runs of the new Python performance test framework with a new web page set. Page load times are currently being displayed - when you hover over a section of the graph the web url associated with that load time is displayed in the status line. | * This example shows an overlay of two data sets generated by two runs of the new Python performance test framework with a new web page set. Page load times are currently being displayed - when you hover over a section of the graph the web url associated with that load time is displayed in the status line. | ||
[[Image:Perfgraph1.png]] | [[Image:Perfgraph1.png]] | ||
* Here you can see the variety of data collected from the test runs. | |||
[[Image:Perfgraph2.png]] | |||
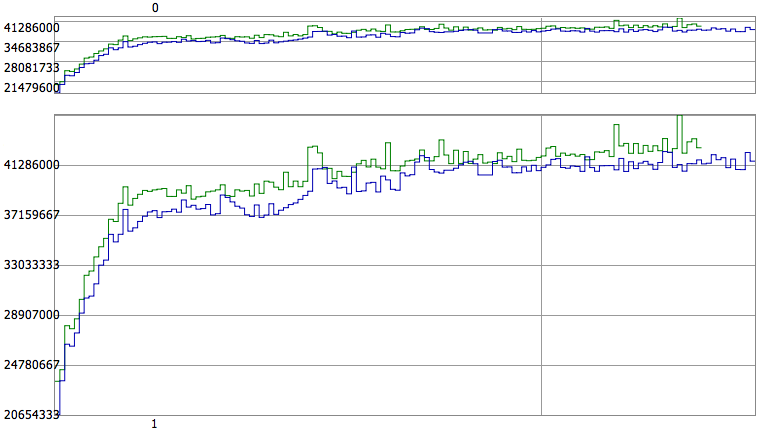
* Finally, a graph comparing the working set size of two runs of the graph server. The working set is sampled per second of test run. | |||
[[Image:Perfgraph3.png]] | |||
== Future Work == | == Future Work == | ||
* Things are still buggy - spend some time concentrating on bug fixes | * Things are still buggy - spend some time concentrating on bug fixes | ||
* Get this on a public server so that people can play with it | * Get this on a public server so that people can play with it | ||
Latest revision as of 22:15, 22 November 2006
Goals
- Extend the new build graph server to handle discrete data sets of the form Time1=Data1, Time2=Data2, etc.
Status
- build graph server code located in the trunk at /mozilla/webtools/new-graph
- an extension has been added to this code to handle discrete data sets. The data sets are displayed as bar gaphs.
Pretty Pictures
- This example shows an overlay of two data sets generated by two runs of the new Python performance test framework with a new web page set. Page load times are currently being displayed - when you hover over a section of the graph the web url associated with that load time is displayed in the status line.
- Here you can see the variety of data collected from the test runs.
- Finally, a graph comparing the working set size of two runs of the graph server. The working set is sampled per second of test run.
Future Work
- Things are still buggy - spend some time concentrating on bug fixes
- Get this on a public server so that people can play with it


