DevTools/Timeline
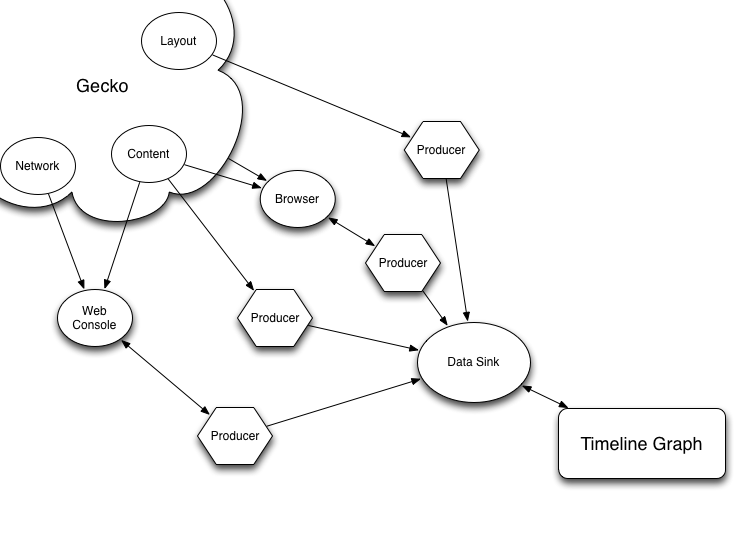
Diagram
Introduction
The Timeline is a graphical display of data that may originate from any number of different data sources. For each source, a Producer watches for, extracts and creates data based on the underlying Component. That data is then sent to the Data Sink which maintains this data for retrieval and display by the Graph.
Content Producers
Each Module or Component we wish to represent in the Timeline will have a Producer attached to it. The implementation of each producer will vary depending on the component it watches, but the data each produces should be of a consistent format.
Event Types
Data created by the Producers will be of several types:
- One-shot: A single moment in time event.
- Interval: An event spanning a duration of time. Intervals must have a Start Time and an End Time (or alternately, a Duration).
- Repeaters: Multiple events that occur at varying points in time. Could be considered as multiple One-shot events that are tied together.
Data Sink
The Data Sink is a central repository for the data created by each Producer. It has a number of known types of data, the simplest of which is a point-in-time event. There can be collections of point-in-time-events (blobs) or more complex events which span segments of time. Most types of data will have additional data associated with it and potentially a link back to an originating source of the event (e.g., the console).
Ultimately, the Data Sink should be Remotable. Sending data to and retrieving data from the Data Sink should be asynchronous. We may even be able to have multiple consumers of a single Data Sink. This will allow a user to observe data from a mobile device in a desktop browser.
Graph
The graphical display. A scrollable, zoomable timeline of events with multiple tracks for each producer. Within each track, we will have additional groupings. The data within the timeline is adaptable to the zoom level of the display. As a user zooms into the timeline or expands the view, more data becomes visible.
Multiple grouped events that occur very close to one another should be grouped together and displayed as "blobs". Blobs can grow depending on the number of events at a given level to indicate the relative "weight" of a set of events in the timeline.
Implementation
See the currently implemented design on Graphical Timeline v1
