Necko/MobileCache/MicroBenchmarks: Difference between revisions
No edit summary |
|||
| (9 intermediate revisions by the same user not shown) | |||
| Line 53: | Line 53: | ||
==== Real-life verification of results from the lab ==== | ==== Real-life verification of results from the lab ==== | ||
Telemetry monitors real-life efficiency of the cache, hence by monitoring the right values we can ensure that improvements we see in the lab also | Telemetry monitors real-life efficiency of the cache, hence by monitoring the right values we can ensure that improvements we see in the lab also benefit real users. Exactly which measurements we need is not entirely clear yet (work is in progress to determine this). | ||
An important point is that in order to verify results like this we | An important point is that in order to verify results like this we must measure the same (or at least very similar) values in microbenchmarks and in telemetry. We should also, of-course, measure other values from telemetry in order to cross-check our results, but in order to verify lab-improvements in real life we must align measurements. The rationale for this is as follows: Let's say we want to improve characteristic A. We make a benchmark to measure A, fix the code, and see a clear improvement of A in the lab so we push the code-fix. Let's say telemetry do ''not'' measure A but rather some other characteristic B. What if B didn't improve (or even degraded)? Is it because A and B are unrelated? Or is it because A actually didn't improve in real-life at all? We must first verify that A actually ''did'' improve in real-life, ''then'' we can discuss why B did ''not'' improve, and finally we can decide whether the code-change is worth keeping. Such results will also increase our understanding of how the caching works in general. | ||
Thus, the suggested strategy is to first introduce a telemetry-probe to gather baseline-data for some characteristic we want to improve, then introduce a code-fix which improves the characteristic in the lab, then finally monitor changes from telemetry to verify | Thus, the suggested strategy is to first introduce a telemetry-probe to gather baseline-data for some characteristic we want to improve, then introduce a code-fix which improves the characteristic in the lab, then finally monitor changes from telemetry to verify the improvement we saw in the lab. In the last step, the particular characteristic should be monitored as well as other (more general) performance-probes for cross-checking. | ||
== The benchmarks == | == The benchmarks == | ||
| Line 64: | Line 64: | ||
=== test_stresstest_cache_with_timing.js === | === test_stresstest_cache_with_timing.js === | ||
This test loads a number of '''different''' resources with uniform size. All responses are 200 Ok, i.e. there are no redirections. The resources are loaded sequentially in a tight loop and the test syncs with cache-io thread after finishing the loop. Each loop is executed for | This test loads a number of '''different''' resources with uniform size. All responses are 200 Ok, i.e. there are no redirections. The resources are loaded sequentially in a tight loop and the test syncs with cache-io thread after finishing the loop. Each loop is executed for a number of different cache-configurations/setups: | ||
#no cache enabled, loading all urls from server, not writing to cache (clearing cache before this step) | #no cache enabled, loading all urls from server, not writing to cache (clearing cache before this step) | ||
#memory-cache | #empty memory-cache, loading all urls from server, write them to cache (clearing cache before this step) | ||
#memory-cache | #memory-cache primed by pervious step, read all urls from cache again | ||
#disk-cache | #empty disk-cache, loading all urls from server, write them to cache (clearing cache before this step) | ||
#disk-cache | #disk-cache primed by pervious step, reading all urls from cache | ||
#memory-cache filled with small (128bytes) entries, loading all urls from server, write them to cache (clear and pre-load cache before this step) | |||
#memory-cache primed by pervious step, read all urls from cache | |||
#memory-cache filled with large (128Kb) entries, loading all urls from server, write them to cache (clear and pre-load cache before this step) | |||
#memory-cache primed by pervious step, read all urls from cache | |||
#disk-cache filled with small (128bytes) entries, loading all urls from server, write them to cache (clear and pre-load cache before this step) | |||
#disk-cache primed by pervious step, read all urls from cache | |||
#disk-cache filled with large (128Kb) entries, loading all urls from server, write them to cache (clear and pre-load cache before this step) | |||
#disk-cache primed by pervious step, read all urls from cache | |||
This whole procedure is repeated over a given list of datasizes, clearing the cache between each repetition. | This whole procedure is repeated over a given list of datasizes, clearing the cache between each repetition. | ||
| Line 76: | Line 84: | ||
Time is measured in two ways: 1) for each individual load by by using the nsITimingChannel interface of the channel, and 2) by measuring run-time of the complete loop from the test itself. | Time is measured in two ways: 1) for each individual load by by using the nsITimingChannel interface of the channel, and 2) by measuring run-time of the complete loop from the test itself. | ||
Informally one can say that this test | Informally one can say that this test triggers loading a large number of uniformly sized resources at the same time, somewhat similar to what happens when starting up firefox with lots of open tabs. Time to finish loading all resources is measured over combinations of memory-cache vs disk-cache, empty cache vs full cache, cache containing small entries vs large entries, and all items found in cache vs no item found in cache. | ||
==== Generated datafiles ==== | ==== Generated datafiles ==== | ||
The test writes data into a number of files. '''Note that''' all files are appended, meaning that if they exist prior to the run, you may have unexpected results... | |||
;summary.dat | ;summary.dat | ||
:Format is multi-data with one datablock for each datasize run by the test. Each datablock has a header describing the datasize, then one row for each of the | :Format is multi-data with one datablock for each datasize run by the test. Each datablock has a header describing the datasize, then one row for each of the configurations described above, summing up the results from the loop. Datapoints are | ||
#description of the configuration | #description of the configuration | ||
| Line 133: | Line 141: | ||
:You need to copy the file "timingchannel-<size>.dat" to "timingchannel.dat" for the size you want to study. Plots detailed information for each resource loaded, one plot for each configuration. The format used is a rowstacked histogram where each column shows total time from creating the channel to loading has finished. '''Note''' that columns show time for each load separately (all times starting at 0) as opposed to a real time-line for the dataset. | :You need to copy the file "timingchannel-<size>.dat" to "timingchannel.dat" for the size you want to study. Plots detailed information for each resource loaded, one plot for each configuration. The format used is a rowstacked histogram where each column shows total time from creating the channel to loading has finished. '''Note''' that columns show time for each load separately (all times starting at 0) as opposed to a real time-line for the dataset. | ||
==== Sample results ==== | ==== Sample results (debug-builds with logging enabled) ==== | ||
This benchmark has currently been run successfully on two different Linux-systems and on a Nexus S. Below are extracts from the results, focusing on time to load resources as seen from JavaScript. The plots have been obtained by editing "summary.dat", sorting results by cache-type and splitting up in "hits" and "misses" which are plotted separately. Modifying the generated files and the GnuPlot-files to do this is trivial and I won't discuss it here. | |||
{| | The first set of graphs show "misses", i.e. it indicates time to search the cache for each resource, clear space for it, load it and finally set it up to be saved. Resources are served from the in-built httpd.js - loading with cache disabled is included first as a reference. Hence, the first group in the histogram show resources loaded without caching. The next three groups show results with disk-cache enabled and the last three groups show results for the memory-cache. | ||
| [[ | |||
| [[ | {| | ||
| [[File:Watson-summary-misses-100iter.png|400px]] | |||
| [[File:HPEnvy-summary-misses-100iter.png|400px]] | |||
| [[File:Nexuss-summary-misses-100iter.png|400px]] | |||
|} | |} | ||
Note that a memory-cache full of small entries (sixth group) seems to perform bad for large resources (surprising, because you'd expect the disk-cache to always be slower). | |||
Note that a disk-cache full of small entries (third group) is generally slower than the empty disk-cache (second group). | |||
The second set of graphs show "hits", i.e. the time spent to load the resource from cache. It indicates time to search for the resource as well as load it. Columns are sorted as in previous set of graphs. | |||
{| | {| | ||
| [[File:Watson-summary-hits.png|400px]] | |||
| [[File:HPEnvy-summary-hits.png|400px]] | |||
| [[File:Nexuss-summary-hits.png|400px]] | |||
|- | |||
|- | |||
|- | |||
| | |||
|} | |} | ||
Note the time to load 2K and 8K entries from a memory-cache filled with small entries (sixth group)... Could this be caused by the access-pattern or is it generally true? | |||
== Wanted tests == | == Wanted tests == | ||
Latest revision as of 15:09, 22 December 2011
This Is Work In Progress - Information Is Incomplete
This page describes the cache-related microbenchmarks. Contact BjarneG (bherland@mozilla.com) for further information and/or the benchmarks themselves.
Purpose
The primary purpose of the microbenchmarks is to be tools for programmers evaluate the effect of code-changes on cache-performance. I.e. you run benchmarks, record results, apply code-changes, then run the benchmarks again. The goal is that comparing two results should give a reasonable idea how your changes affects cache-performance.
Implications of the above include
- we need to be able to reproduce results rather consistently, i.e. we cannot have (too) different results from different runs
- we might have to process raw results somehow; perhaps use some statistical properties
- at the very least we must quickly be able to see variance/deviation in a dataset
- what we measure (e.g. which units we use) is not really important - we just need something comparable
A secondary purpose of these microbenchmarks is to uncover performance-problems on new platforms. For example, enabling the disk-cache is rumored to hurt performance on mobile devices, based on running TP4 on one or two devices with and without disk cache enabled. With a reasonable set of benchmarks we can pinpoint more precisely what the problem is, which devices it affects, and do something about it.
Implications of the above include
- we must somehow be able to identify a bad test-result (i,e, we cannot just report reproducible, abstract numbers - the results must be somehow understandable)
- we need many measurements
- search time vs cache sizes vs full/empty cache
- read-time vs cache-type vs large/small data
- write-time vs cache-type vs large/small data (writing is off main-thread, but will probably still impact performance on devices?)
- creating, clearing, adjusting size, dooming entries
- with many and detailed measurements we most likely also need a way to depict results graphically
Telemetry vs microbenchmarks
There has been some discussion about using telemetry instead of xpcshell-based microbenchmarks. Current thinking is that they are complementary and that telemetry is real-life browsing patterns on real-life platforms and environments, whereas microbenchmarks are artificial browsing patterns running on a controlled platform in a lab-environment. Some points:
- It is impractical to experiment with code-changes using telemetry to measure the effect - a benchmark in the lab is much more practical for this.
- Using telemetry it is very difficult (if not impossible) to get the context of your measurements. For example, suppose you measure the time to evict a cache-entry from disk-cache; for such a measurement to make sense you also need to know the number of entries in the cache and the total size of the cache. This context-information is hard to get using telemetry alone.
- On the other hand, telemetry mirrors the experience of real users and is the (only?) way to ensure that improvements are valid in real-life.
Two very different factors determine cache-performance from a user-perspective:
- Performance of the platform (efficiency of CPU, memory- and disk-speed etc)
- We deal with this by implementing efficient datastructures, various file-schemes, multi-threading etc. Measuring this is the focus of microbenchmarks.
- Browsing patterns (how often do users revisit sites, how deep in sites do they browse etc)
- We deal with this by scaling caches and implementing smart replacement-algorithms. This factor is not taken into account by microbenchmarks - only telemetry handles this.
Hence, current thinking is that telemetry and microbenchmarks are complementary mechanisms suitable for optimizing different factors of cache-performance. Microbenchmarks will be used as described in the section above and telemetry will be used for the following
Identify general areas of interest
Telemetry will provide lots of data and an important job is to read and analyze this. We expect to see unexpected patterns from telemetry, and such patterns should trigger the creation of microbenchmarks to investigate specific areas.
Tune parameters to make microbenchmarks more realistic
Conditions in the lab are bound to be different from those seen by real users. However, in the lab we control most parameters and by knowing realistic values for these parameters we can tune our lab-setup to similar conditions, making our lab-testing more realistic. We can use telemetry to find such values. Examples of this include
- Bandwidth: What's the typical bandwidth(s) seen by a user? In the lab we normally load resources from the local host...
- Latency/RTT: How long does it typically take from sending a request to the server before the response starts to appear?
- Cache-sizes: What's the typical cache-size out there?
Real-life verification of results from the lab
Telemetry monitors real-life efficiency of the cache, hence by monitoring the right values we can ensure that improvements we see in the lab also benefit real users. Exactly which measurements we need is not entirely clear yet (work is in progress to determine this).
An important point is that in order to verify results like this we must measure the same (or at least very similar) values in microbenchmarks and in telemetry. We should also, of-course, measure other values from telemetry in order to cross-check our results, but in order to verify lab-improvements in real life we must align measurements. The rationale for this is as follows: Let's say we want to improve characteristic A. We make a benchmark to measure A, fix the code, and see a clear improvement of A in the lab so we push the code-fix. Let's say telemetry do not measure A but rather some other characteristic B. What if B didn't improve (or even degraded)? Is it because A and B are unrelated? Or is it because A actually didn't improve in real-life at all? We must first verify that A actually did improve in real-life, then we can discuss why B did not improve, and finally we can decide whether the code-change is worth keeping. Such results will also increase our understanding of how the caching works in general.
Thus, the suggested strategy is to first introduce a telemetry-probe to gather baseline-data for some characteristic we want to improve, then introduce a code-fix which improves the characteristic in the lab, then finally monitor changes from telemetry to verify the improvement we saw in the lab. In the last step, the particular characteristic should be monitored as well as other (more general) performance-probes for cross-checking.
The benchmarks
Each benchmark below is described and explained, and we also show output results from selected platforms. Note that results are provided as examples and information only; the benchmarks are meant for evaluating effect of code-changes, i.e. you run the benchmarks without and with your change and compare the results to evaluate the effect of your code.
test_stresstest_cache_with_timing.js
This test loads a number of different resources with uniform size. All responses are 200 Ok, i.e. there are no redirections. The resources are loaded sequentially in a tight loop and the test syncs with cache-io thread after finishing the loop. Each loop is executed for a number of different cache-configurations/setups:
- no cache enabled, loading all urls from server, not writing to cache (clearing cache before this step)
- empty memory-cache, loading all urls from server, write them to cache (clearing cache before this step)
- memory-cache primed by pervious step, read all urls from cache again
- empty disk-cache, loading all urls from server, write them to cache (clearing cache before this step)
- disk-cache primed by pervious step, reading all urls from cache
- memory-cache filled with small (128bytes) entries, loading all urls from server, write them to cache (clear and pre-load cache before this step)
- memory-cache primed by pervious step, read all urls from cache
- memory-cache filled with large (128Kb) entries, loading all urls from server, write them to cache (clear and pre-load cache before this step)
- memory-cache primed by pervious step, read all urls from cache
- disk-cache filled with small (128bytes) entries, loading all urls from server, write them to cache (clear and pre-load cache before this step)
- disk-cache primed by pervious step, read all urls from cache
- disk-cache filled with large (128Kb) entries, loading all urls from server, write them to cache (clear and pre-load cache before this step)
- disk-cache primed by pervious step, read all urls from cache
This whole procedure is repeated over a given list of datasizes, clearing the cache between each repetition.
Time is measured in two ways: 1) for each individual load by by using the nsITimingChannel interface of the channel, and 2) by measuring run-time of the complete loop from the test itself.
Informally one can say that this test triggers loading a large number of uniformly sized resources at the same time, somewhat similar to what happens when starting up firefox with lots of open tabs. Time to finish loading all resources is measured over combinations of memory-cache vs disk-cache, empty cache vs full cache, cache containing small entries vs large entries, and all items found in cache vs no item found in cache.
Generated datafiles
The test writes data into a number of files. Note that all files are appended, meaning that if they exist prior to the run, you may have unexpected results...
- summary.dat
- Format is multi-data with one datablock for each datasize run by the test. Each datablock has a header describing the datasize, then one row for each of the configurations described above, summing up the results from the loop. Datapoints are
- description of the configuration
- minimum value from the loop
- maximum value from the loop
- calculated mean over the results from the loop
- standard deviation over all data from the loop
- number of iterations in the loop
- time measured by the test using Data.now() for the loop
- time measured by the test using Data.now() for the loop, including syncing with the cache-io thread at the end
- timingchannel-<bytes>.dat
- One file for each datasize run by the test. The format is multi-data with one datablock for each configuration. Each row represents one resource-load in actual order. The datapoints in each row are
- timestamp of create
- time from create to asyncOpen
- time from asyncOpen to cacheEntryAvailable
- time from cacheEntryAvailable to cacheReadStart
- time from cacheReadStart to cacheReadEnd
alternatively (if loaded from channel, not from cache)
- timestamp of create
- time from create to asyncOpen
- time from asyncOpen to cacheEntryAvailable
- time from cacheEntryAvailable to responseStart
- time from responseStart to responseEnd
Referring to Telemetry-data accumulated by nsLoadGroup, (2+3) corresponds to Telemetry::HTTP_PAGE_OPEN_TO_FIRST_FROM_CACHE alternatively Telemetry::HTTP_PAGE_OPEN_TO_FIRST_RECEIVED, and (2+3+4) corresponds to Telemetry::HTTP_PAGE_COMPLETE_LOAD.
Files to work with GnuPlot (requires Gnuplot >= 4.4)
- settings.gnu
- setup for the histogram, title of plot etc. Edit this to describe your platform.
- plot-summary.gnu
- Plots mean-values from summary.dat in one histogram, grouped by first column. Standard deviation in the dataset is indicated as an errorline. This is the recommended starting-point for studying results from a test-run.
- plot-minmax-summary.gnu
- Like above but indicates min and max values from the dataset instead of stddev.
- plot-summary-per-size.gnu and plot-minmax-summary-per-size.gnu
- Plots summaries like the two plots above, but makes one plot for each datasize to avoid scaling-issues in the plot.
- plot-summary-from-javascript.gnu
- Plots summaries of average loading-times seen from JS. The term "INCLUDING sync" means that the time includes time to sync with the cache-io thread after finishing a loop.
- plot-timingchannel.gnu
- You need to copy the file "timingchannel-<size>.dat" to "timingchannel.dat" for the size you want to study. Plots detailed information for each resource loaded, one plot for each configuration. The format used is a rowstacked histogram where each column shows total time from creating the channel to loading has finished. Note that columns show time for each load separately (all times starting at 0) as opposed to a real time-line for the dataset.
Sample results (debug-builds with logging enabled)
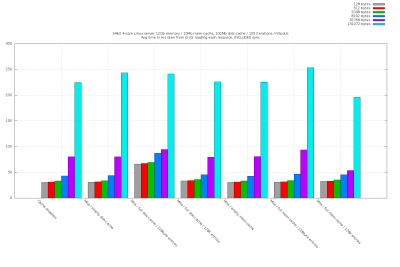
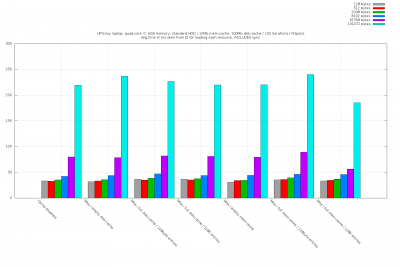
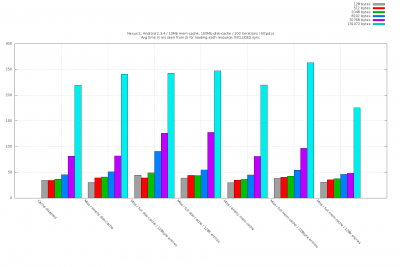
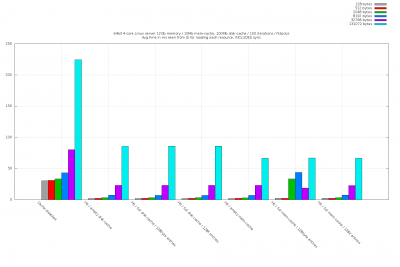
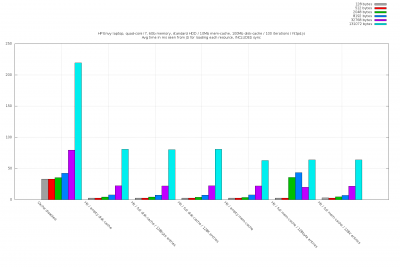
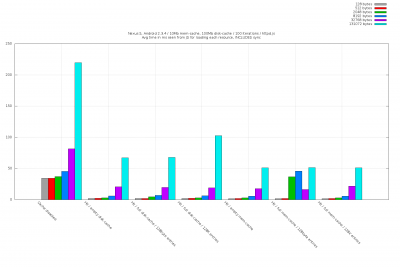
This benchmark has currently been run successfully on two different Linux-systems and on a Nexus S. Below are extracts from the results, focusing on time to load resources as seen from JavaScript. The plots have been obtained by editing "summary.dat", sorting results by cache-type and splitting up in "hits" and "misses" which are plotted separately. Modifying the generated files and the GnuPlot-files to do this is trivial and I won't discuss it here.
The first set of graphs show "misses", i.e. it indicates time to search the cache for each resource, clear space for it, load it and finally set it up to be saved. Resources are served from the in-built httpd.js - loading with cache disabled is included first as a reference. Hence, the first group in the histogram show resources loaded without caching. The next three groups show results with disk-cache enabled and the last three groups show results for the memory-cache.
|
|
|
Note that a memory-cache full of small entries (sixth group) seems to perform bad for large resources (surprising, because you'd expect the disk-cache to always be slower).
Note that a disk-cache full of small entries (third group) is generally slower than the empty disk-cache (second group).
The second set of graphs show "hits", i.e. the time spent to load the resource from cache. It indicates time to search for the resource as well as load it. Columns are sorted as in previous set of graphs.
|
|
|
Note the time to load 2K and 8K entries from a memory-cache filled with small entries (sixth group)... Could this be caused by the access-pattern or is it generally true?
Wanted tests
Unordered and informal list of tests we may also want to create
- variation of the other tests where we start out with a full cache
- i.e. investigate if there is a significant impact of evicting entries while we use the cache
- measure time to search a cache
- mem- and disk-only, but also the combination of them I believe. Make sure we search the cache without finding the entry.
- identify entry-size where disk-cache is clearly slower than mem-cache
- probably OS- or device-specific but it may be worth finding in case we can learn something general from it
- driver which can take a list of resources and measure time to load them all [Bjarne works on this]
- we can extract this info from e.g. Talos or by using telemetry, and it should probably be hierarchical (some resources causes other to load)