Auto-tools/Projects/Charts
Overview of charts.mozilla.org
This project is responsible for presenting the dashboards and details required by management to track progress on the B2G releases and highlight possible bottlenecks in development.
This project is highly visible to the FirefoxOS team, and Mozilla in general.
Hacking/Contribution
If you are good at making elegant UI, or are familiar with client side web frameworks, and you like having your work front-and-center (along with all the accolades and "constructive" feedback that comes with it) then this project is for you!
Contributing to charts.mozilla.org has some distinct benefits over other projects:
- Your work is highly visible to people working at Mozilla
- The pages are static HTML and Javascript; and can be deployed fast
- Assuming you already know Javascript; there is a small learning curve.
- Setting up a development environment is very simple
Code
The code and setup instructions can be found on Github. Since these are simple static pages, you will find it quite easy.
Contact
You can contact me, Kyle Lahnakoski
- IRC: ekyle@irc.mozilla.org (in #ateam)
- email: klahnakoski@mozilla.com
I am available to get you started and discuss bus that you may find interesting.
Good First Bugs
This is a current list of bugs (from Bugzilla) that have been marked as simple, and exist primarily to ensure you are familiar with Github and the pull request process.
No results.
0 Total; 0 Open (0%); 0 Resolved (0%); 0 Verified (0%);
All Open Issues
This is a list of bugs that are more involved. Please read through them to get an idea of where we would like to go with this project.
No results.
0 Total; 0 Open (0%); 0 Resolved (0%); 0 Verified (0%);
Architecture
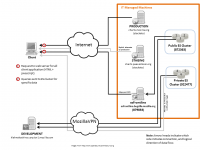
The charts.mozilla.org application is a pure Javascript client running on the browser. It accesses the BMO/ES cluster for data.
Web Server
The application itself is served as a set of static html and javascript files from the Mozilla PAAS Stackato servers. There are two versions, Production and Staging; the latter will usually have more features, while being slightly more buggy. Please use the staging server as much as possible: like Firefox Nightly, using staging will help find bugs sooner.
Code for each version is in a separate branch
| Server | URL | Source Code |
|---|---|---|
| production | http://charts.mozilla.org/ | https://github.com/mozilla/charts |
| staging | http://charts.paas.allizom.org/ | https://github.com/mozilla/charts/tree/allizom |
Since the app is entirely client-side, it does not matter where the application is served from (I have various development versions on my people page). If both these servers are down, a simple git clone can allow you to "serve" the app directly from your local filesystem.
esFrontline
esFrontline is a simple Python-based proxy to limit ES requests to search requests and limit the indexes exposed. Other than these restrictions, this proxy is invisible to client application. See https://wiki.mozilla.org/BMO/ElasticSearch for more details.
ElasticSearch Clusters
Once the application is downloaded it will attempt to contact both the private and public clusters simultaneously; whichever responds will be chosen for all future connections, with preference given to the private cluster. The queries for the dashboard are then sent to the cluster as the dashboard app requires.
The clusters are configured to accept requests from any client. Hopefully this will promote development of alternative dashboards and charts.
Development
The Development server is responsible for secondary indexes built from the main bug_version. Currently it maintains the hierarchy index for determining recursive dependencies on bugs.
Slowness
There are some sources of slowness:
- esFrontline - being Python, and simple, may be adding about 1/4 second latency to all ES searches
- Virtual Machines - The nodes of the ES clusters are hosted on VMs, and may be contributing to some slowness.
- Code - Nothing is minimized, some pages even pause to load JavaScript dynamically.
Production Support
Is there a problem with production? Read on...
Points of Contact for Technical Issues
- For problems with the application itself, e.g. 404 errors, see cturra or others in #paas on irc.
- To restart PaaS, use the Stackato web console
- To upload a new image:
git clone https://github.com/mozilla/charts.git- Use the
stackato.ymlimage to deploy:
- stackato target api.paas.allizom.org
- stackato login
- stackato update
- For problems with the database, e.g. basic framework loads but no data appears, see jakem, cyliang, or fubar in #it on irc.
Instructions
Past Problems
CORS
The charts application makes cross-platform requests: The app is served from charts.mozilla.org and data requested from esfrontline.bugzilla.mozilla.org. This requires the various proxy servers (not shown in architecture) ensure the Access-Control-Allow-Origin HTTP response header be set appropriately. In the past it has been shown this header is stripped from the esFrontline response and set according to Operations' guidelines.
Clusters Down or Not Responding
ElasticSearch is still prone to OutOfMemoryExceptions. Occasionally, this will bring down nodes in the cluster. The best solution has always been to reboot the problem nodes (or all of them).
The chance of data loss is very low: First, the data is replicated 2 times (for a total of three copies). Second, the ETL daemon (responsible for filling the cluster) performs some simple data checks, and writes full history of all changed bugs: Effectively overwriting corruption on any bugs that does occur. Corruption on inactive bugs can linger; assuming corruption exists, and assuming a change happened when the cluster was misbehaving, and assuming the ETL did not detect the misbehavior. Third, there are consistency checks built into MoDevMetrics that monitors or consistency between bug versions, corruption is sometimes detected, and inevitably fixed by the next ETL run.
