Engagement/Analytics/Webtrends/Tracking
Custom Conversion Events: DCS Tracking Code
This page is meant to explain how to implement and measure custom conversion events when launching your marketing campaign.
There are a couple of different tagging options depending on what type of reporting you wish to do. I will present each here:
1. Basic 2-step Scenario Analysis reporting usually tracks the presentation of an action (a.k.a an impression) and the actualization of that action, usually a click.
For example, a user may land on a page on the Mozilla.org site that presents them with the option to download Firefox -an impression. The user may then decide to download Firefox by clicking on a link that downloads the application.
So step 1, impression, step 2 click on the download button.
In order to capture this behavior within Webtrends you would apply the following tags as specified below:
In the page header please apply the following META tags (it is these tags that specify the above-mentioned 'impression'):
<META name="WT.si_n" content="Download Firefox" />
<META name="WT.si_x" content="1" />
In order to capture the click event, please apply the following dcsMultiTrack call to the onClick event handler of the associated link:
    dcsMultiTrack('DCS.dcssip', 'www.mozilla.org',
    'DCS.dcsuri', '/en-US/download',
    'WT.ti', 'Link: Download Firefox',
    'WT.dl', 99,
    'WT.si_n', 'Download Firefox',
    'WT.si_x', '2')
Please note the structure of the dcsMultiTrack function call:
dcsMultiTtrack('Name1', 'Value1', 'Name2', 'Value2', ... , 'NameN', 'ValueN')
Here is a short description of the above parameters:
- DCS.dcssip - the domain of the page you wish to track
- DCS.dcsuri - the uri of the page you wish to track
- WT.ti - the link title
- WT.dl - a parameter that specifies a given action - for dcsMultiTrack clicks we use 1
- WT.si_n - the name of the associated 'scenario' you are tracking
- WT.si_x - the step of the associated 'scenario' you are tracking -note for the impression this value is equal to 1 and for the click (or other conversion point) it is equal to 2
CRITICAL: When creating a scenario analysis please consider that it represents a unique set of steps that ultimately result in a conversion. For example, there are several unique pathways a user can follow to download Firefox. Each of these should be considered a separate scenario analysis and tagged accordingly. Re-using scenario analysis names (WT.si_n) across multiple scenario analyses will result in incorrect data and inaccurate reports.
In cases where the conversion action is not unique (e.g. downloading Firefox) it is still necessary to uniquely identify each pathway to our system. This can be accomplished by assigning multiple values to both WT.si_n and WT.si_x using a semi-colon delimiter. For example, on the Firefox download 'Thank You' page (the loading of this page is considered the conversion point) you can set the following META tags:
<META name='WT.si_n', content='download_firefox_A; download_firefox_B'>
<META name='WT.si_x', content='2;2'>
NOTE: The number of semi-colon delimited values for both WT.si_n and WT.si_x must always match.
2. Another type of reporting that requires the use of dcsMultiTrack is campaign tracking. Campaign tracking is also usually a 2-step process. Typically, a banner ad exists on an external site that 'lands' on Mozilla.org. This banner ad is identified by a custom Webtrends parameter called WT.mc_id; it is included as a query parameter on the banner link. The landing page usually presents an action like downloading Firefox. The goal is to determine the effectiveness of a campaign by identifying how many downloads originated from users that clicked the banner ad -or in other words, how many downloads can be 'attributed' to the campaign effort.
In order to capture the download click event we apply the following dcsMultiTrack call to the onClick event handler of the associated link:
    dcsMultiTrack('DCS.dcssip', 'www.mozilla.org',
    'DCS.dcsuri', '/en-US/download',
    'WT.ti', 'Link: Download Firefox',
    'WT.z_convert', 'download_firefox',
    'WT.dl', 99)
Notice that this may seem redundant because we already implemented a dcsMultiTrack call to track the download click associated with the Scenario Analysis tracking. In fact, it is both redundant and incorrect to make two dcsMultiTrack calls to track the same behavior. So in this case, we can combine the dcsMultiTrack call into one:
    dcsMultiTrack('DCS.dcssip', 'www.mozilla.org',
    'DCS.dcsuri', '/en-US/download',
    'WT.ti', 'Link: Download Firefox',
    'WT.z_convert', 'download_firefox',
    'WT.dl', 99,
    'WT.si_n', 'Download Firefox',
    'WT.si_x', '2')
This last call will provide Webtrends with enough data to create both a Scenario Analysis report AND a Campaign Tracking report. Once this data is captured within the Webtrends logfile, custom reports can be created in the OnDemand environment.
Automatic Link Tracking: How Do I Turn it On???
Please see the Video Tracking section below.
Once Automatic Link Tracking has been turned on, you should be able to start tracking your data in the Link Tracking reports available in your profile under the All Custom Reports heading.
How To Track Product Downloads
Product download reports are useful for measuring the effectiveness of product download landing pages. For example you may have a marketing campaign that lands on the Firefox download page but for some reason the number of downloads is low. This could be due to any number of issues (e.g. a mis-configured marketing campaign, the site going down, etc...). A good place to start ruling things out is the landing page itself. Maybe there are several third party advertisements with similar looking download buttons confusing the user, maybe the download button is in a confusing spot, you get the picture.
The best approach here is to let the data speak by adding some custom parameters to the landing pages and then creating a custom report. The metric we will use to measure the effectiveness of the landing page will be conversions (or conversion %). This is the number of product downloads divided by the total number of visits to the associated landing page. To capture this data we will need two parameters, one to track the loading of the landing page (WT.z_pdp, pdp is short for product download page) and the other to track the clicking of the download button (WT.z_convert).
To track the loading landing please add the following meta tag to the header of your page that contains the download link (Note: If multiple products are available for download please use a semi-colon delimited list):
<meta name="WT.z_pdp" content="<see below>">
then in the onclick event handler of the download button please add the following dcsMultiTrack call:
   dcsMultiTrack('DCS.dcssip',document.location.host,
   'DCS.dcsuri',document.location.pathname,
   'WT.ti',document.title,
   'WT.dl',99,
   'WT.z_convert','<see below>')
Once the page and appropriate buttons have been tagged a custom report can be created to track the conversion rate and other metrics. More on that later.
Here is a list of products that we're currently tracking:
| Name | WT.z_pdp | WT.z_convert |
|---|---|---|
| Firefox | firefox | downloadfirefox |
| Firefox for Android | firefox_android | Get Firefox for Android |
| Firefox Beta | firefox_beta | Firefox Beta |
| Firefox Mobile Beta | firefox_mobile_beta | Firefox Beta for Mobile |
| Firefox Aurora | firefox_aurora | Firefox Aurora |
| Firefox Mobile Aurora | firefox_mobile_aurora | Firefox Aurora for Mobile |
Video Tracking: How to Tag It
Setting up your page to track video plays is pretty straight-forward:
1. Include the following JavaScript file: http://www.mozilla.org/js/mozilla-video-tools.js in your page header.
2. Verify that the Webtrends JavaScript file you're using supports automatic link tracking. It should contain a code snippet similar to the following:
WebTrends.prototype.dcsET=function(){
  var e=(navigator.appVersion.indexOf("MSIE")!=-1)?"click":"mousedown";
  this.dcsBind(e,this.dcsDownload);
  this.dcsBind("contextmenu",this.dcsRightClick);
  this.dcsBind(e,this.dcsLinkTrack);
}
3. Verify that automatic link tracking is turned on in the inline script on your page:
<script type="text/javascript" src="http://mozcom-cdn.mozilla.net/includes/min/min.js?g=js_stats"></script>
<script type="text/javascript">
//<![CDATA[
var _tag=new WebTrends({"dcsid":"dcst2y3n900000gohmphe66rf_3o6x","rate":5,"fpcdom":"mozilla.org"});
_tag.dcsGetId();
//]]>
</script>
<script>
//<![CDATA[
_tag.trackevents=true;
_tag.dcsCollect();
//]]>
</script>
4. Add the following mark-up to reference the video:
<div id="video-player" class="mozilla-video-control">
    <video
        id="video"
        width="640"
        height="360"
        controls="controls" preload="metadata"
        poster="/img/covehead/video/poster-brand.jpg"
        src="http://videos-cdn.mozilla.net/your_video.webm">
    </video>
</div>
Notice that the id of the div tag is set to video-player. This is required so the reporting engine can differentiate a video play from other types of events that may occur on your page. It must always be set to video-player. Also, the id value in the video tag should designate the name of your video. This will allow Webtrends to distinguish it from other videos on your site.
Once your video has been tagged you should be able to locate it in one of the Video Tracking reports. If not, those reports may need to be added.
DCS Tracking: How to Create a Report
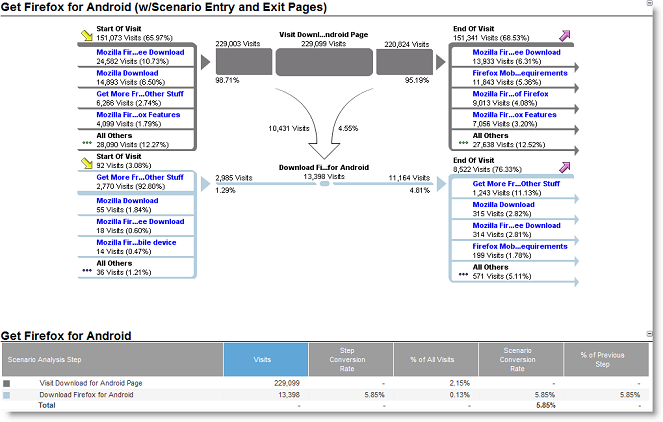
The first type of report we are going to cover is a Scenario Analysis report. These reports are typically used to track a predefined set of behaviors. For example, we may be interested in how many users visit the Firefox download page and then go on to download Firefox.
The Scenario Analysis report contains a funnel view and tabular view, please take a look below:
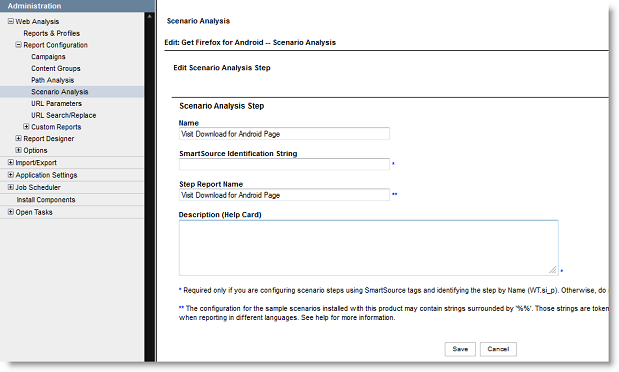
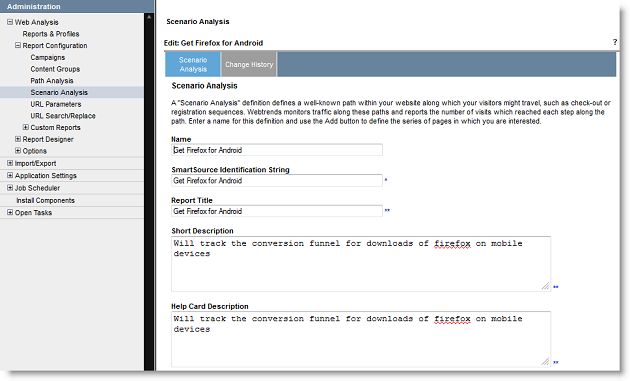
In order to configure the Scenario Analysis reports, please navigate to the following Scenario Analysis report wizard:
Please fill-out the relevant fields, most are self explanatory.
The SmartSource Identification String should match the WT.si_n
parameter specified in the tag.
Go ahead and configure the specific scenario steps by clicking the 'add' button.
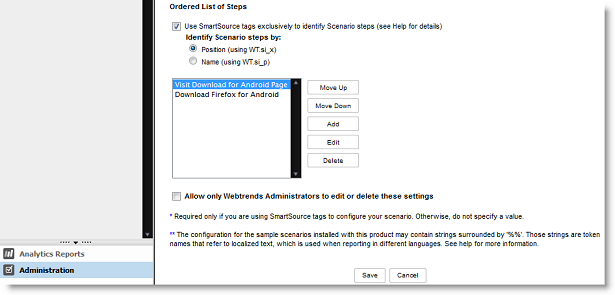
Here you can specify the specific step name as it will appear in the report.
After scenario steps have been added they should appear in the 'Ordered List of Steps' widget. At this point a basic Scenario Analysis report is complete. The next step is to add it to a profile.
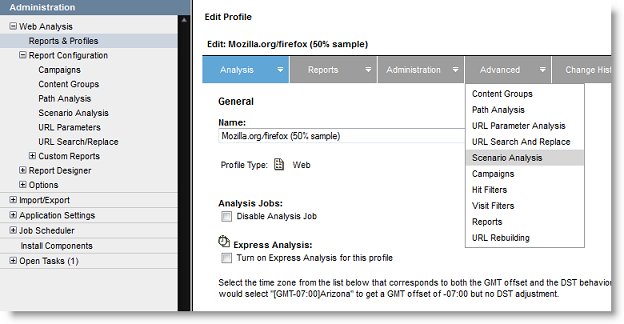
After the Scenario Analysis report has been added to the profile our analysis servers need to cycle before the report is available.
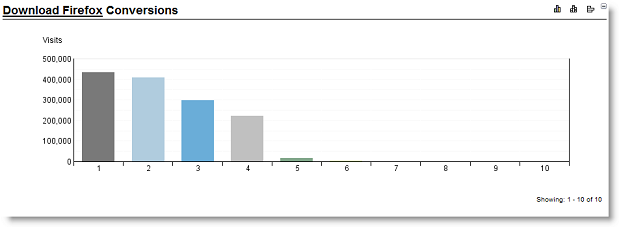
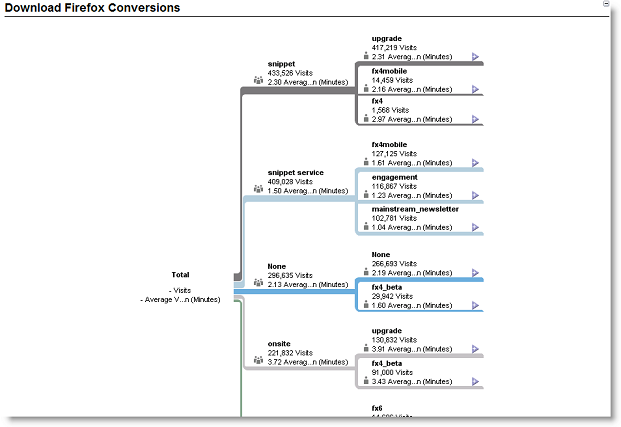
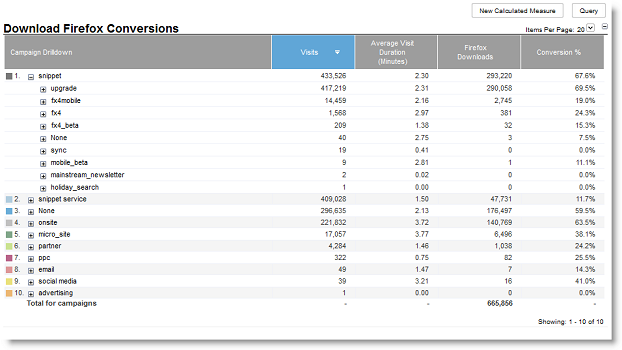
The second type of report we are going to cover is a basic conversion report:
They're are three parts to this report. It breaks down into a graph, tree and table:
After your site has been tagged with the appropriate Webtrends parameters (as mentioned in a previous Wiki entry) you can configure this report.
There are a couple of ways to go about this. I'll cover the long way first (I recommend following this path until you're comfortable with this type of report configuration):
Go into the administration interface and create a new custom report:

The wizard presents four main steps:
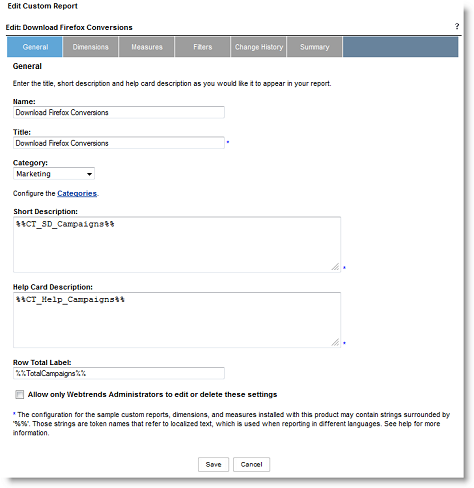
In the general tab, you'll enter basic information.
- Name - specifies how the report will appear in the administration interface.
- Title - the title of the report within the OnDemand UI.
- Category - a way to functionally group various configuration items (e.g. profile, reports, dimensions, measures, filters, etc...). You can add a new category by clicking the highlighted 'Categories' link.
- Short Description - a short summary of the dimensions and measures.
- Help Card Description - a detailed explanation of the schema and purpose of the custom report.
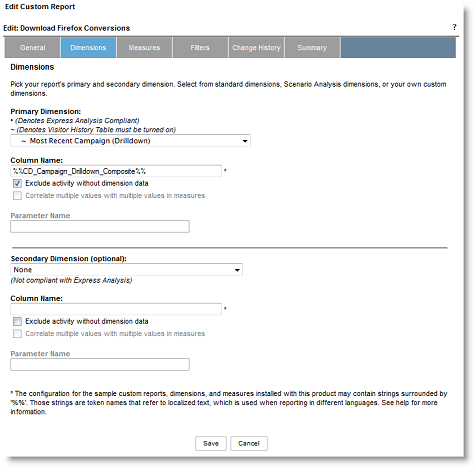
The dimensions tab allow you to choose either a standard or custom dimension to track. In this case, you will be using the Most Recent Campaign (Drilldown):
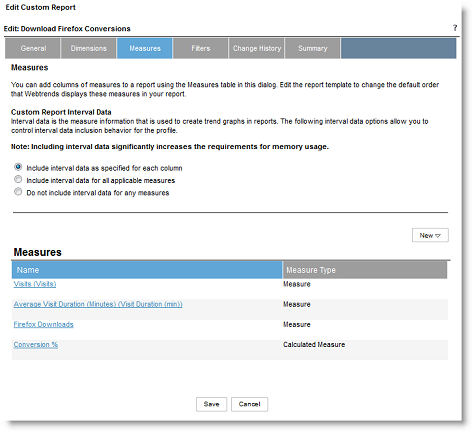
The measures tab allows you to select a set of measures to attribute to each dimension:
- Visits (Visits) - the count of visits associated with a given Campaign Id.
- Average Visit Duration (Minutes) (Visit Duration (min)) - self explanatory.
- Firefox Downloads - this measure is based upon the custom parameter WT.z_convert that we specified in the tag.
- Conversion % - a calculated measure Firefox Downloads/Visits * 100
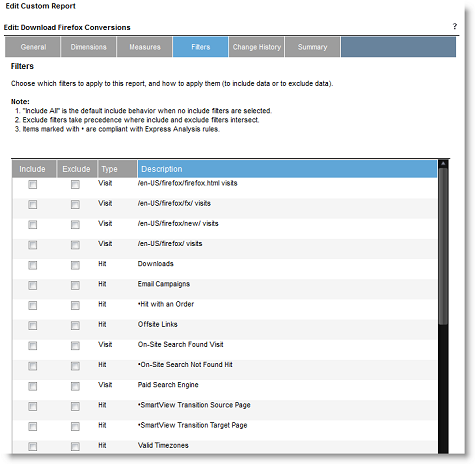
The final custom report configuration we're going to cover is the report filter. The report filter allows you specify a subset of data to include in a custom report. This filter can use several criteria (e.g. campaign Id) to specify the data set you're interested in. In this case we have no need for a report filter because we are interested in all campaigns associated with downloading Firefox.
The typical and easier way to create a custom report is to create a copy of a similar report and make the appropriate edits.
In any event, once the report is created add it to the relevant profiles and let them analyze.
Incorporating Analytics into the Software Development Pipeline
Prior to deploying site modifications please have a designated Webtrends analyst provide verification that all necessary analytics tags are in place and properly configured. The hope is to minimize the introduction of human error and thus the disruption of data collection. This could be as simple as including the desginated Webtrends analyst on the Bugzilla bug and requiring their sign-off as part of the QA process.
Note: Inadverdent placement or misconfiguration of analytics tags can have a significant impact on both data collection and historical accuracy of data.
Debugging: Why Isn't My Custom Report Populating???
If your report isn't populating please verify the following:
- The relevant pages are tagged with the Webtrends data collection JavaScript.
- The Webtrends tag is firing correctly - a good tool for this is httpfox.
- The dcsid set in the tag is included as a datasource in the profile that contains the custom report.
- The profile's filters are configured to capture the appropriate pages.
Note: If no profile filter is specified, then the profile will include all data associated with the datasources attached to the profile. - The custom report filters are configured to capture the appropriate pages.
Note: If no report filter is specified, then the report will include all records specified by the profile level filter.
