Performance Triage
Nomination
Bugzilla
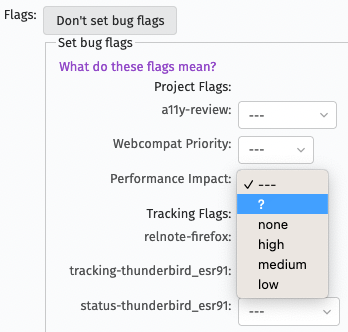
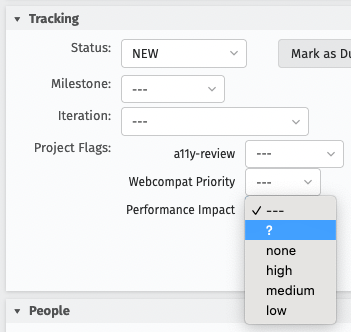
To (re)nominate a bug for triage, set the Performance Impact flag in Bugzilla to ?
This can be found by clicking Show Advanced Fields followed by Set bug flags when entering a new bug:
Or by expanding the Tracking section when editing an existing bug:
GitHub
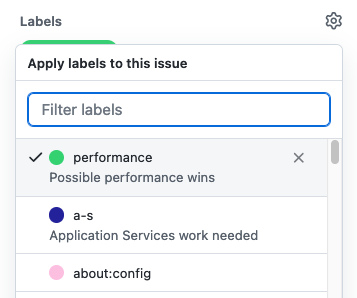
To nominate a bug for triage, add the Performance label to an issue. This can be done by filing an new issue with the "Performance issue" template:
Or by opening an existing issue on GitHub and selecting the label from the right-hand bar:
Currently, only the following GitHub repositories are supported:
Queries
Performance triage
18 Total; 18 Open (100%); 0 Resolved (0%); 0 Verified (0%);
Performance triage (pending needinfo)
10 Total; 10 Open (100%); 0 Resolved (0%); 0 Verified (0%);
Recently opened bugs with performance keywords in the summary
43 Total; 43 Open (100%); 0 Resolved (0%); 0 Verified (0%);
Triage process
Introduction
The goal of performance triage is to identify the extent to which bugs impact the performance of our products, and to move these bugs towards an actionable state. The goal is not to diagnose or fix bugs during triage. We triage bugs that have been nominated for triage and bugs in the Core::Performance component that do not have the performance impact project flag set.
During triage we may do any/all of the following:
- Request further information from the reporter (such as a profile)
- Set the performance impact project flag
- Add performance keywords
- Move the bug to a more appropriate component
Who is responsible for triage?
Everyone is welcome to take part in triage. By default, everyone on the performance team is enrolled in triage rotation, but we also have participants from outside the team.
How do I schedule a triage meeting?
If you are on triage duty, you will receive an invitation as a reminder to schedule the triage meeting on the shared performance calendar with the nominated sheriffs invited at a time that works for them. The responsibility of scheduling the meeting falls to the lead sheriff. Once a triage meeting has been scheduled, it’s a good idea to remove the reminder event from the calendar to avoid confusion. It’s a good idea to use the shared calendar, as this increases the visibility of the performance triage and allows other members of the team to contribute or observe the process.
The rotation script is not perfect, and doesn’t know when people are on PTO or otherwise unavailable. If the lead sheriff is available, it is their responsibility to either schedule the triage with the remaining available sheriff or to identify a suitable substitute for the unavailable sheriff(s). If the lead sheriff is unavailable, this responsibility passes onto the remaining available sheriffs.
How do I run a triage meeting?
The following describes the triage process to follow during the meeting:
- Ask if others would prefer you to share your screen. This can be especially helpful for those new to triage.
- Open the first triage query to show bugs nominated for triage or in the Core::Performance component without the performance impact project flag set. The bugs are sorted from oldest to newest. For each bug in the list, follow these steps:
- Bugs that look like tasks that were filed by members of the Performance team will generally need to be moved to the Core::Performance Engineering component.
- For defects: Determine if the bug is reproducible and actionable. If not, add a needinfo for the reporter asking for more information and move onto the next bug. We have a template that you can modify as needed.
- For all bugs (including enhancements):
- Set the performance impact project flag.
- Add the appropriate performance keywords.
- Move the bug to the correct Bugzilla component.
- Open the second triage query to show bugs that have open needinfo requests. The bugs are sorted from oldest to newest. For each bug in the list, follow these steps:
- If the needinfo was set less than 2 weeks ago, move onto the next bug.
- If the needinfo was set more than 2 weeks ago but less than 2 months ago, consider adding a needinfo for either: another reporter of the issue, someone with access to the appropriate platform(s) to attempt to reproduce the issue, or a relevant subject matter expert.
- If the open needinfo was set more than 2 months ago, close the bug as inactive. You can modify the inactive bug template as needed.
- If time permits, open the third triage query to show recently opened bugs with performance related keywords in the summary. If any of these look like performance bugs, they can either be triaged the same way as bugs in the initial query or they can be nominated for triage in a subsequent meeting.
What if things don't go as expected?
Don't panic! The triage process is not expected to be perfect, and can improve with your feedback. Maybe the result of the triage calculator doesn't feel right, or you find a scenario that's not covered in these guidelines. In this case we recommend that you bring it up in #perf-triage, or consider scheduling a short meeting with some triage leads (you can see some recent leads in the triage rotation). If in doubt, leave a comment on the bug with your thoughts and move on. There's a chance someone will respond, but if not the next performance triage sheriffs may have some other ideas.
How do I determine the performance impact project flag?
The performance impact project flag is used to indicate a bug’s relationship to the performance of our products. It can be applied to all bugs, and not only defects. The triage calculator should be used to help determine the most appropriate value for this flag. In addition to setting the performance impact project flag, make sure to use the “Copy Bugzilla Comment” button and paste this as a comment on the bug.
For more information about what this flag, and it's settings mean see this blog post.
How do I determine the performance keywords?
There are several performance related keywords, which can be helpful to understand how our performance issues are distributed, or whenever there’s a concerted effort to improve a particular aspect of our products. The triage calculator may recommend keywords to set, and by typing “perf:” in the keywords field in Bugzilla, you will see the available options. Select all that apply to the bug.
How do I determine the correct Bugzilla component?
Ideally we would only have bugs in the Core::Performance component that are the responsibility of the engineers in the performance team. For performance bugs to have the best chance of being fixed, it's important to assign them to the correct component. In some cases the correct component will be obvious from the bug summary, description, or steps to reproduce. In other cases, you may need to do a bit more work to identify the component. For example, if there's a profile associated with the bug, you could see where the majority of time is being spent using the category annotations.
How do I read a performance profile?
It's useful to be able to understand a profile generated by the Firefox Profiler, and hopefully someone in the triage meeting will be able to help. If you find an interesting profile, or just want to understand how to use them to analyse a performance problem, we encourage you to post a link to the profile (or bug) in #joy-of-profiling where someone will be happy to help. The profile may even be analysed during one of the regular "Joy of Profiling" open sessions that can be found on the Performance Office Hours calendar.
Triage calculator
The Performance Impact Calculator was developed to assist in identifying and applying the performance impact project flag and performance keywords consistently. If you have feedback or would like to suggest changes to this tool, please share these in the #perf-triage Matrix channel.
Triage rotation
The sheriffs are allocated on a weekly basis, which is published here. The rotation is generated by this script.
Templates
New bug
This template is included in the description for new bugs opened in the Core::Performance component. If a bug is opened in another component and then moved to Core::Performance, this template can be used as needed to request additional information from the reporter.
### Basic information

Steps to Reproduce:


Expected Results:


Actual Results:


---

### Performance recording (profile)

Profile URL:
(If this report is about slow performance or high CPU usage, please capture a performance profile by following the instructions at https://profiler.firefox.com/. Then upload the profile and insert the link here.)

#### System configuration:

OS version:
GPU model:
Number of cores:
Amount of memory (RAM):

### More information

Please consider attaching the following information after filing this bug, if relevant:

 - Screenshot / screen recording
 - Anonymized about:memory dump, for issues with memory usage
 - Troubleshooting information: Go to about:support, click "Copy text to clipboard", paste it to a file, save it, and attach the file here.

---

Thanks so much for your help.
Moved to Core::Performance
This bug was moved into the Performance component. Reporter, could you make sure the following information is on this bug?

 - For slowness or high CPU usage, capture a profile with http://profiler.firefox.com/ , upload it and share the link here.
 - For memory usage issues, capture a memory dump from about:memory and attach it to this bug.
 - Troubleshooting information: Go to about:support, click "Copy raw data to clipboard", paste it into a file, save it, and attach the file here.

Thank you.
No longer able to reproduce
This bug doesn’t seem to happen anymore in current versions of Firefox. Please reopen or file a new bug if you see it again.
No response from reporter
With no answer from the reporter, we don’t have enough data to reproduce and/or fix this issue. Please reopen or file a new bug with more information if you see it again.
Expected behaviour
This is expected behavior. Please reopen or file a new bug if you think otherwise.
Website issue
According to the investigation, this is a website issue. Please reopen or file a new bug if you think otherwise.


